Learn to trade
and survive like a whale
From candle-reading to scalping setups and whale/liquidity tracking — a free 24-guide curriculum you follow in order, from beginner to advanced. We break famous techniques down into chart procedures, and we don't hide their limits or reproducibility debates. Every concept is verified against live whale data. Educational, observational material — not trading advice or a promise of returns.
🟢 Beginner — Foundations
Chart-reading and risk fundamentals. Start here, in order.01 Start Here — The Learning Map and Stage-by-Stage Milestones
Open the advanced material first and your account is the first thing to wobble. Using a six-rung ladder — survival, charts, risk, setups, market phase, verification — this guide maps the order to read the academy in and the milestones that tell you when you're ready to climb to the next step.
02 How to Protect Your Capital — Defense Against Hacks, Phishing, Exchanges, and Scams
What zeroes out a beginner's account isn't a charting mistake — it's hacks, phishing, exchange failure, and scams. A structured walkthrough of the capital-defense gate to clear before you go live.
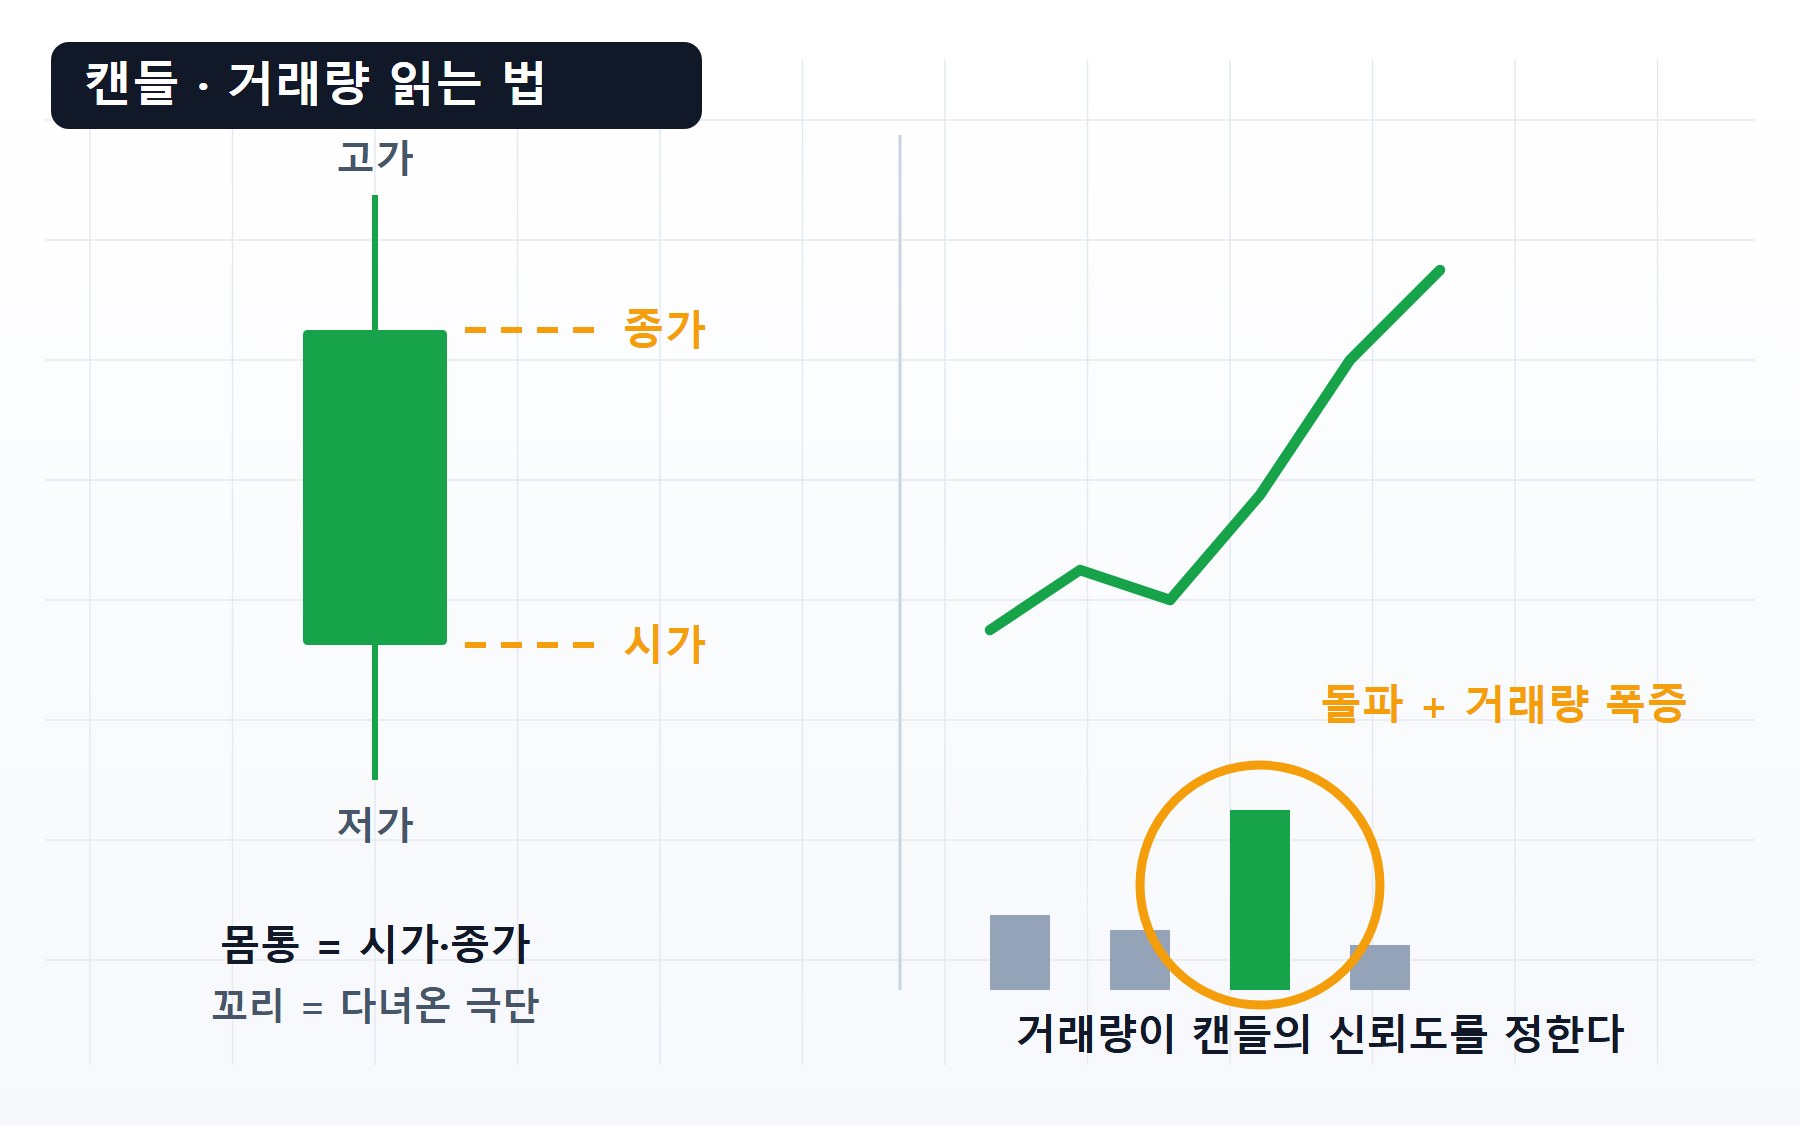
03 Candles and Volume — The First Grammar of Chart Reading
Learn to read candlestick charts as execution records, not memorized patterns. Covers body and wick interpretation, filtering candle reliability by volume versus average, and the traps of low-volume candles — all at a beginner level.
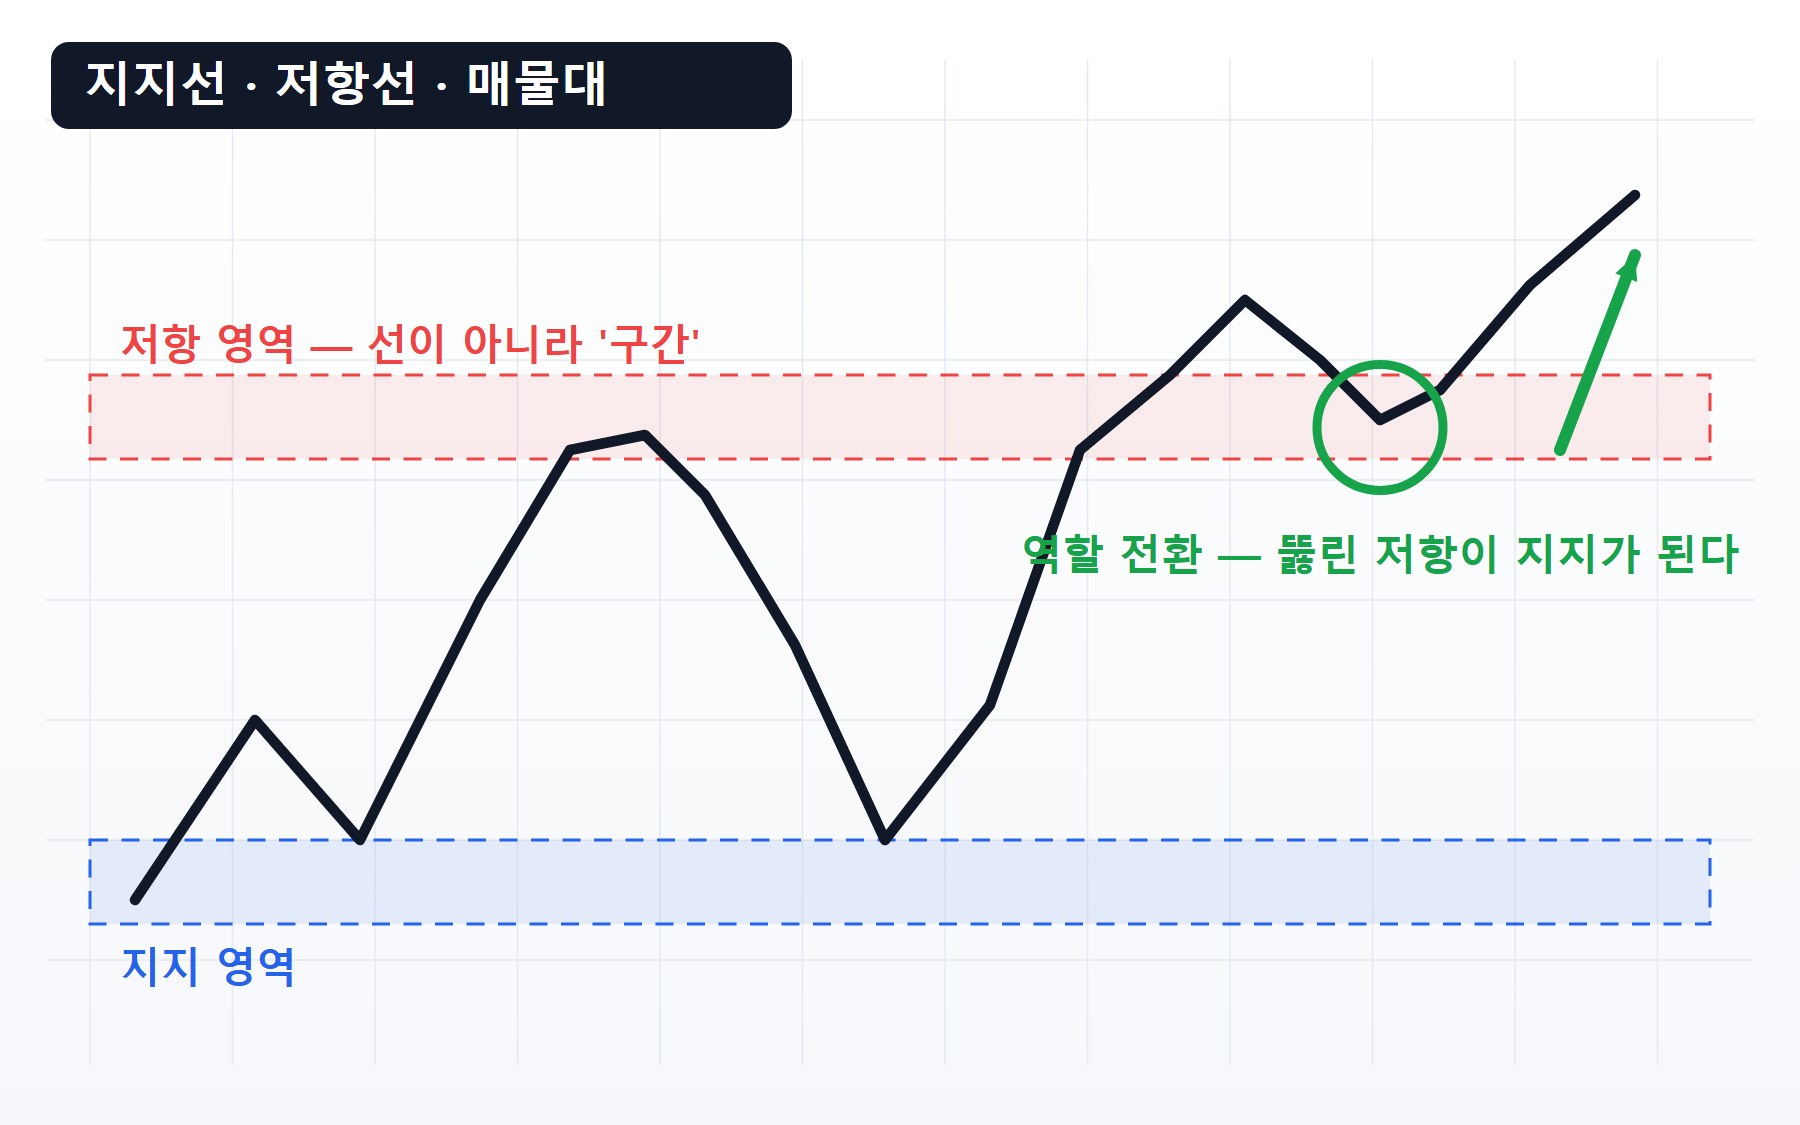
04 How to Draw Support and Resistance — It's a Zone, Not a Line
A practical walkthrough of how support and resistance actually get drawn: mapping zones instead of lines, grading strength by touch count and recency, the S/R flip, and how crypto futures let you verify liquidation clusters as measured — not guessed — supply zones.
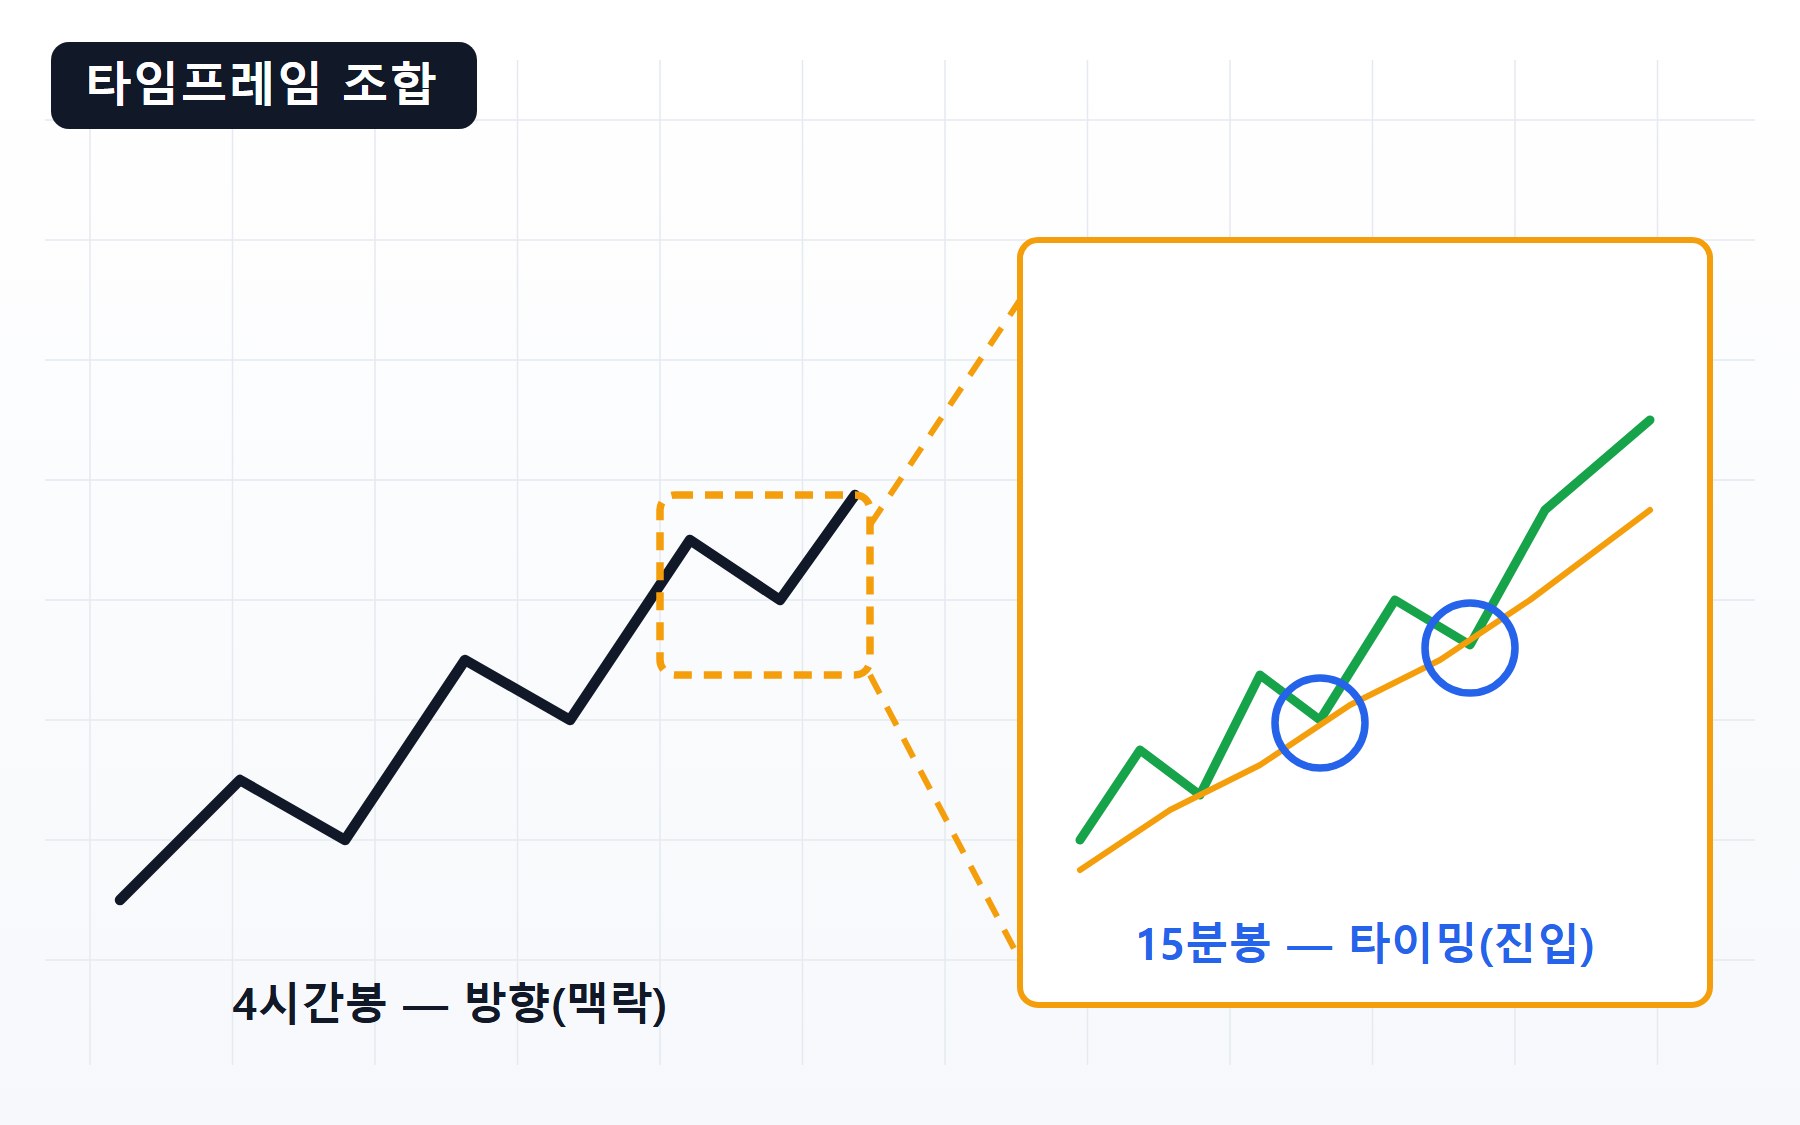
05 Chart Timeframes — Higher for Direction, Lower for Timing
"Which timeframe should I trade?" is actually the wrong question. This guide breaks down the division of labor — higher timeframes for direction, lower timeframes for timing — walks through the daily → 4-hour → 15-minute three-step process, and confronts the trap of switching timeframes when a trade goes against you.
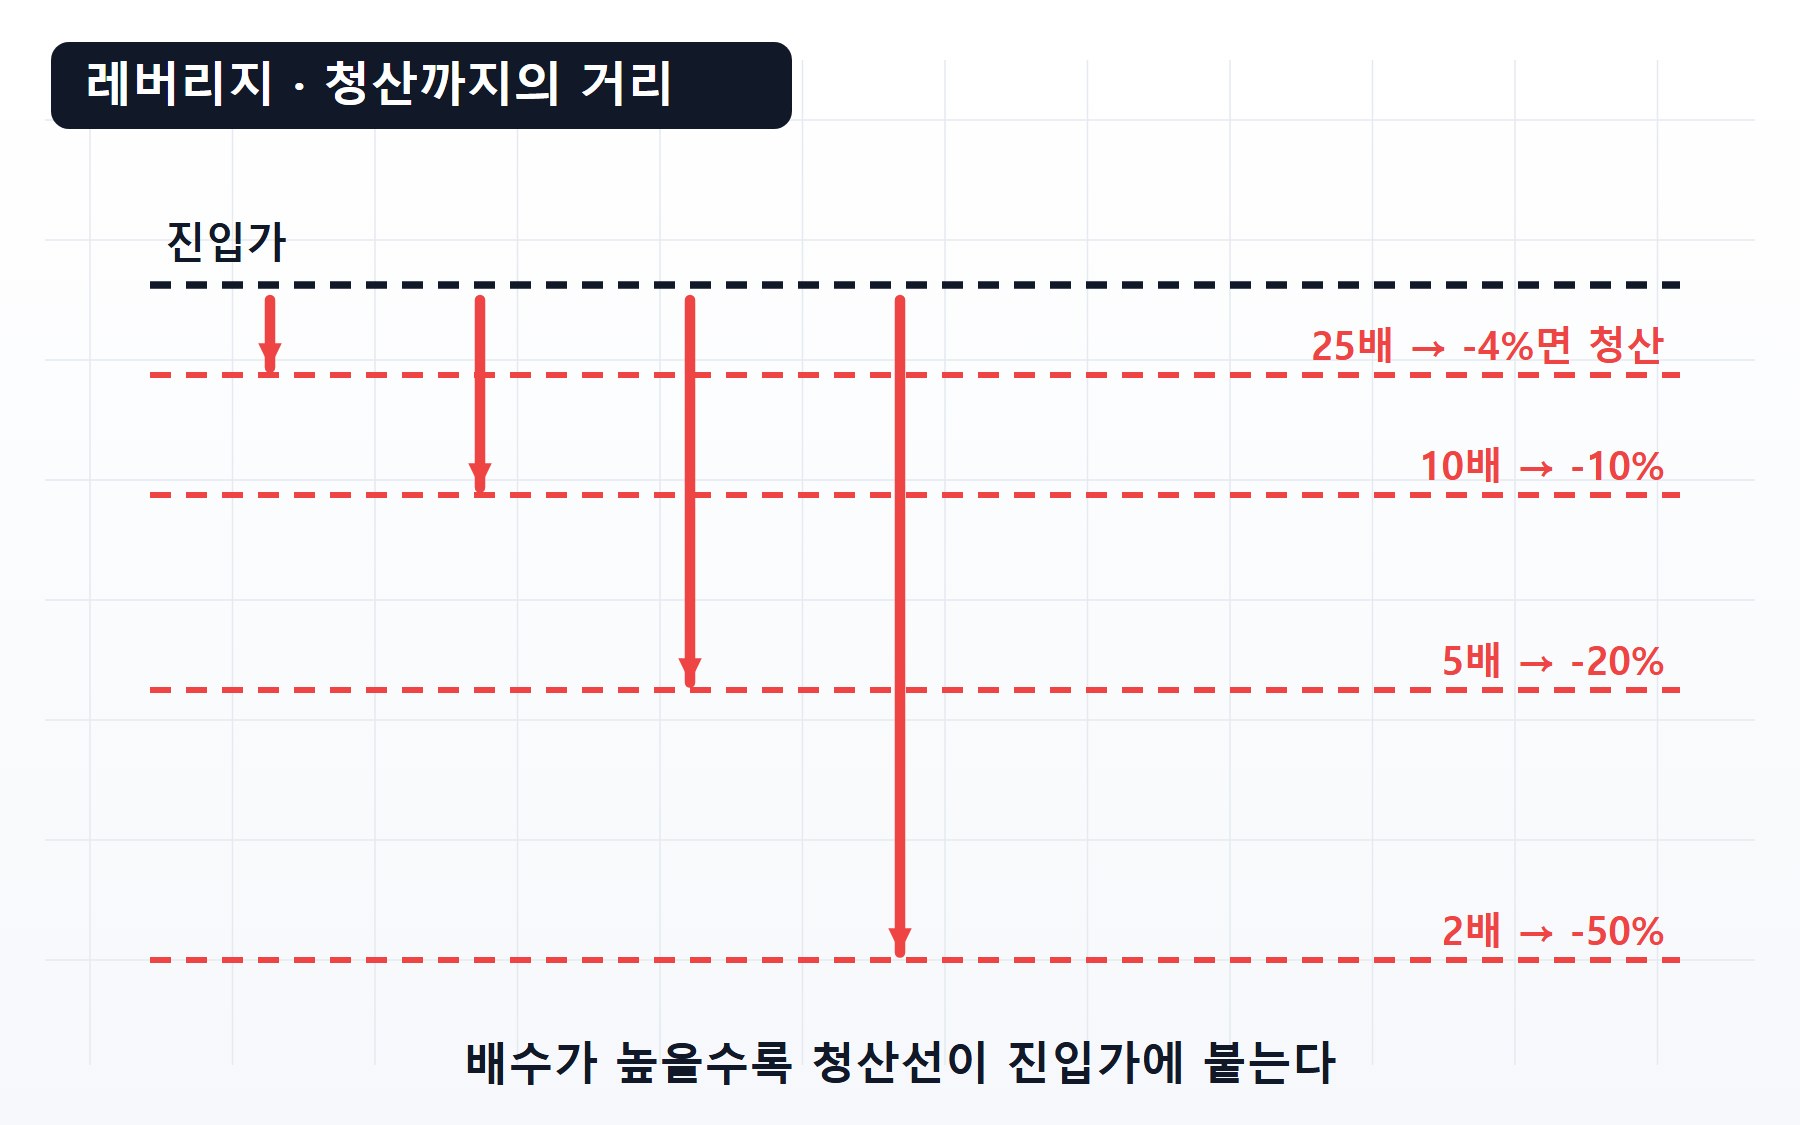
06 The Math of Leverage — Liquidation Distance, Isolated vs. Cross, Effective Leverage
Why N-times leverage gets liquidated at roughly a 1/N move against you, worked through with the formula and numeric examples — plus the collateral difference between isolated and cross margin, a procedure for measuring effective leverage across your whole account, and how fees and funding compound the math.
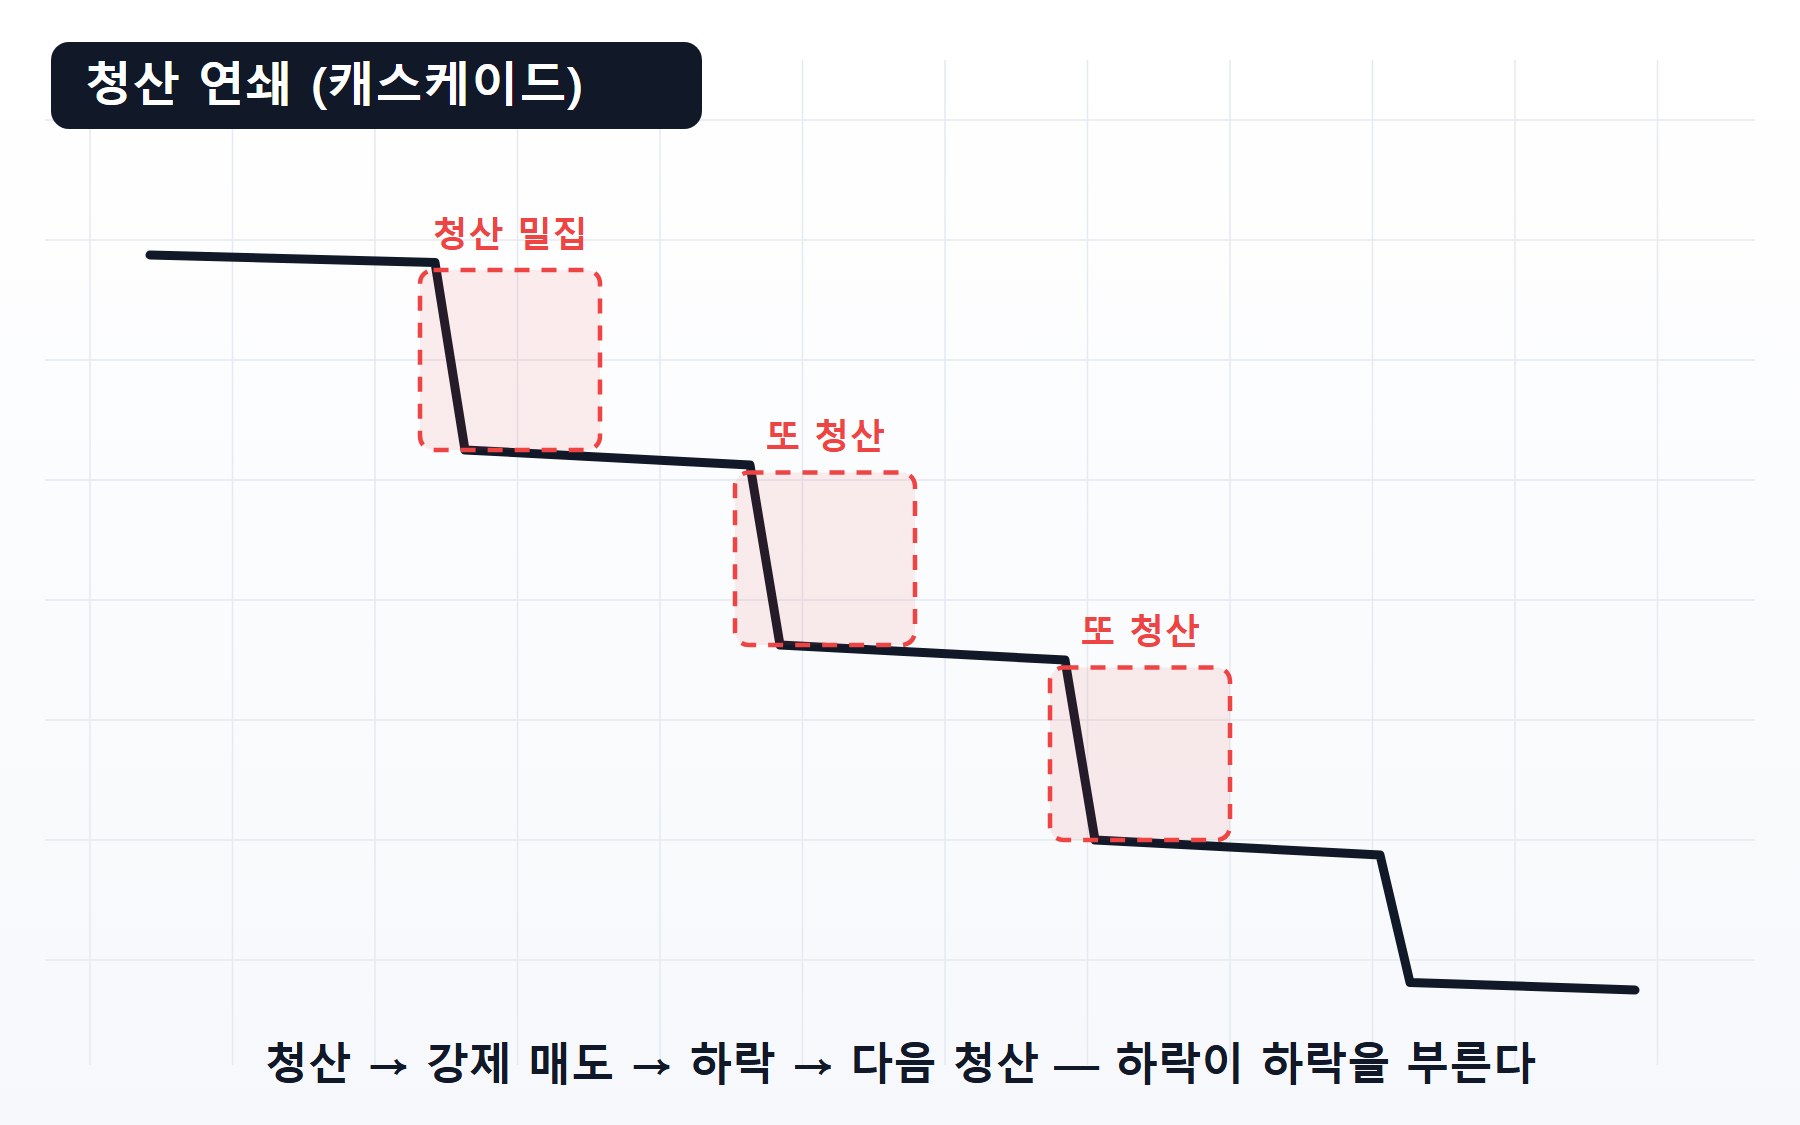
07 Why You Get Liquidated — the Mechanics of Forced Liquidation and How to Prevent It
How maintenance margin draws the liquidation line, the four mistakes traders keep repeating, how one liquidation feeds the next in a cascade, and a pre-entry prevention procedure — all dissected with worked numbers.
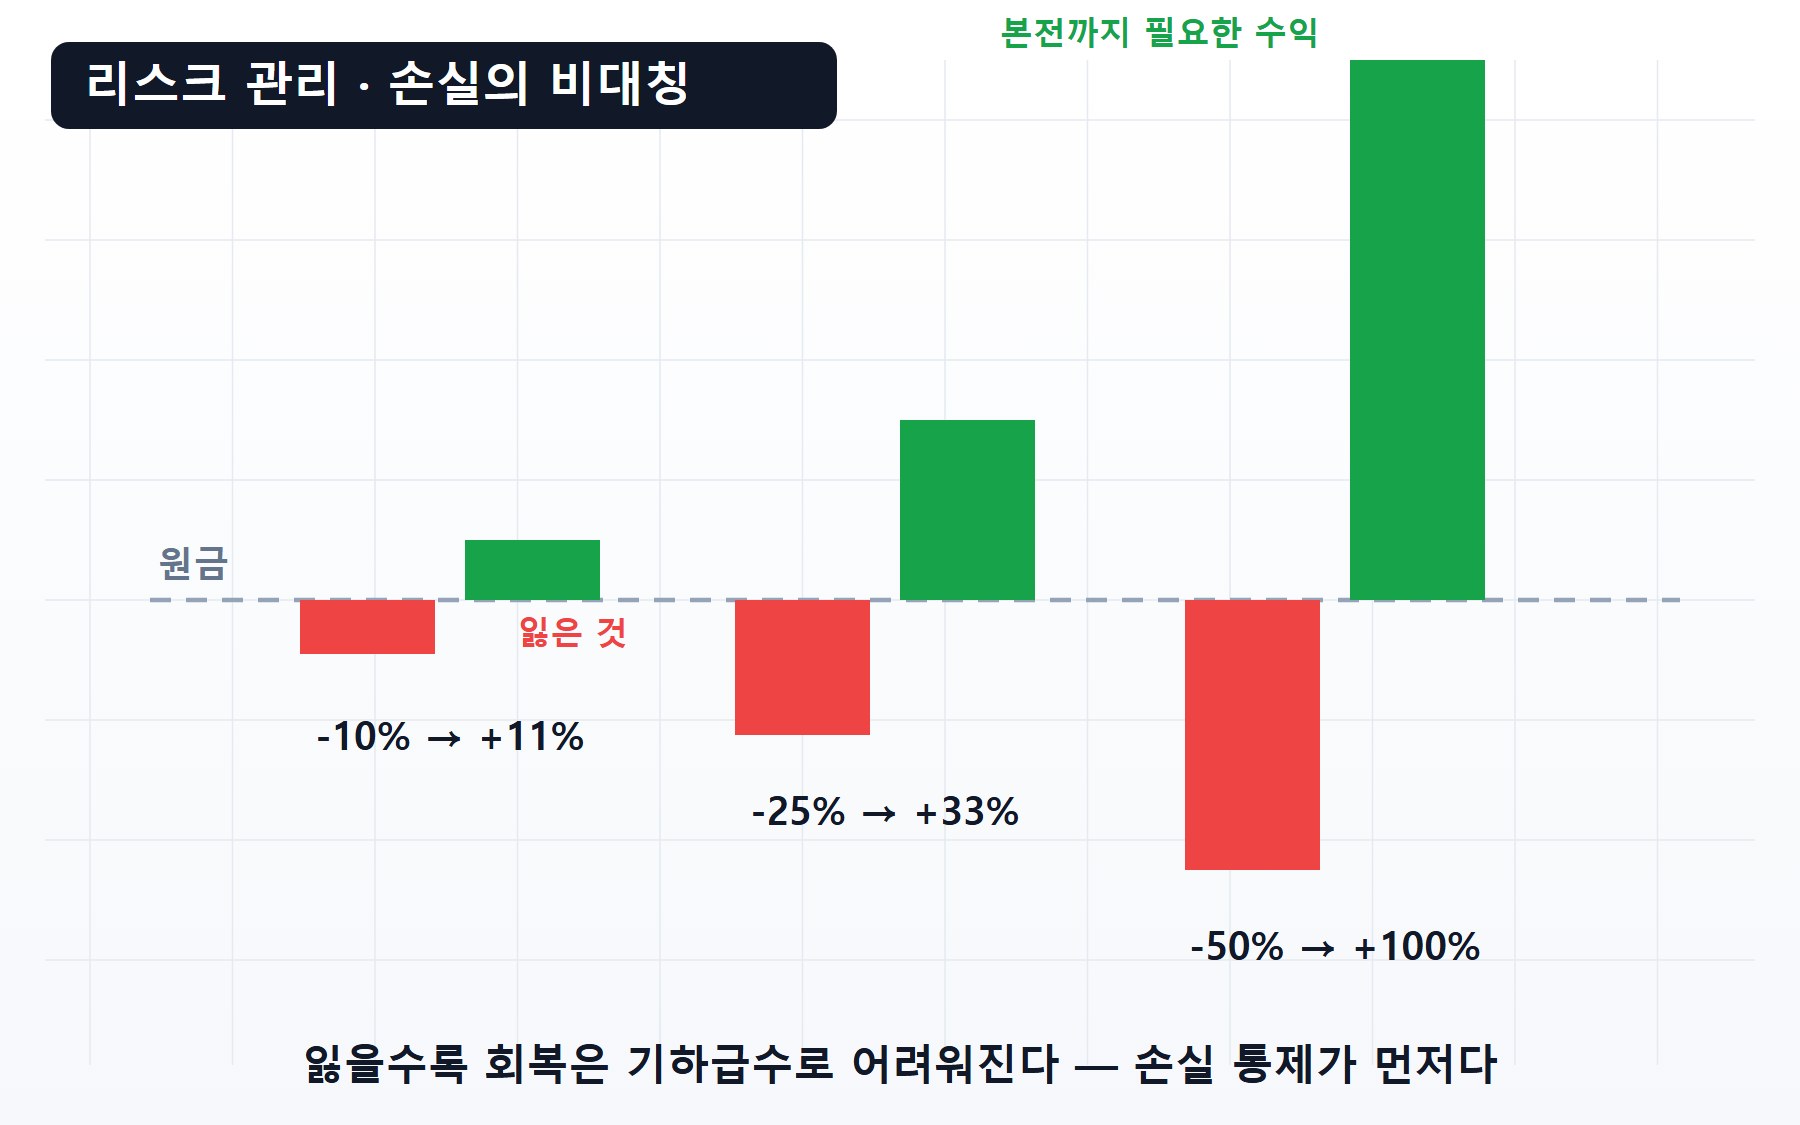
08 Risk Management — 1R, Position Sizing, and Designing Your Stop Rules
A position-sizing procedure that fixes the amount you'll lose when you're wrong (1R) first, then works backward from stop distance to size — walked through with real numbers. Covers structure-based stops, losing-streak limits, and where these rules fall short.
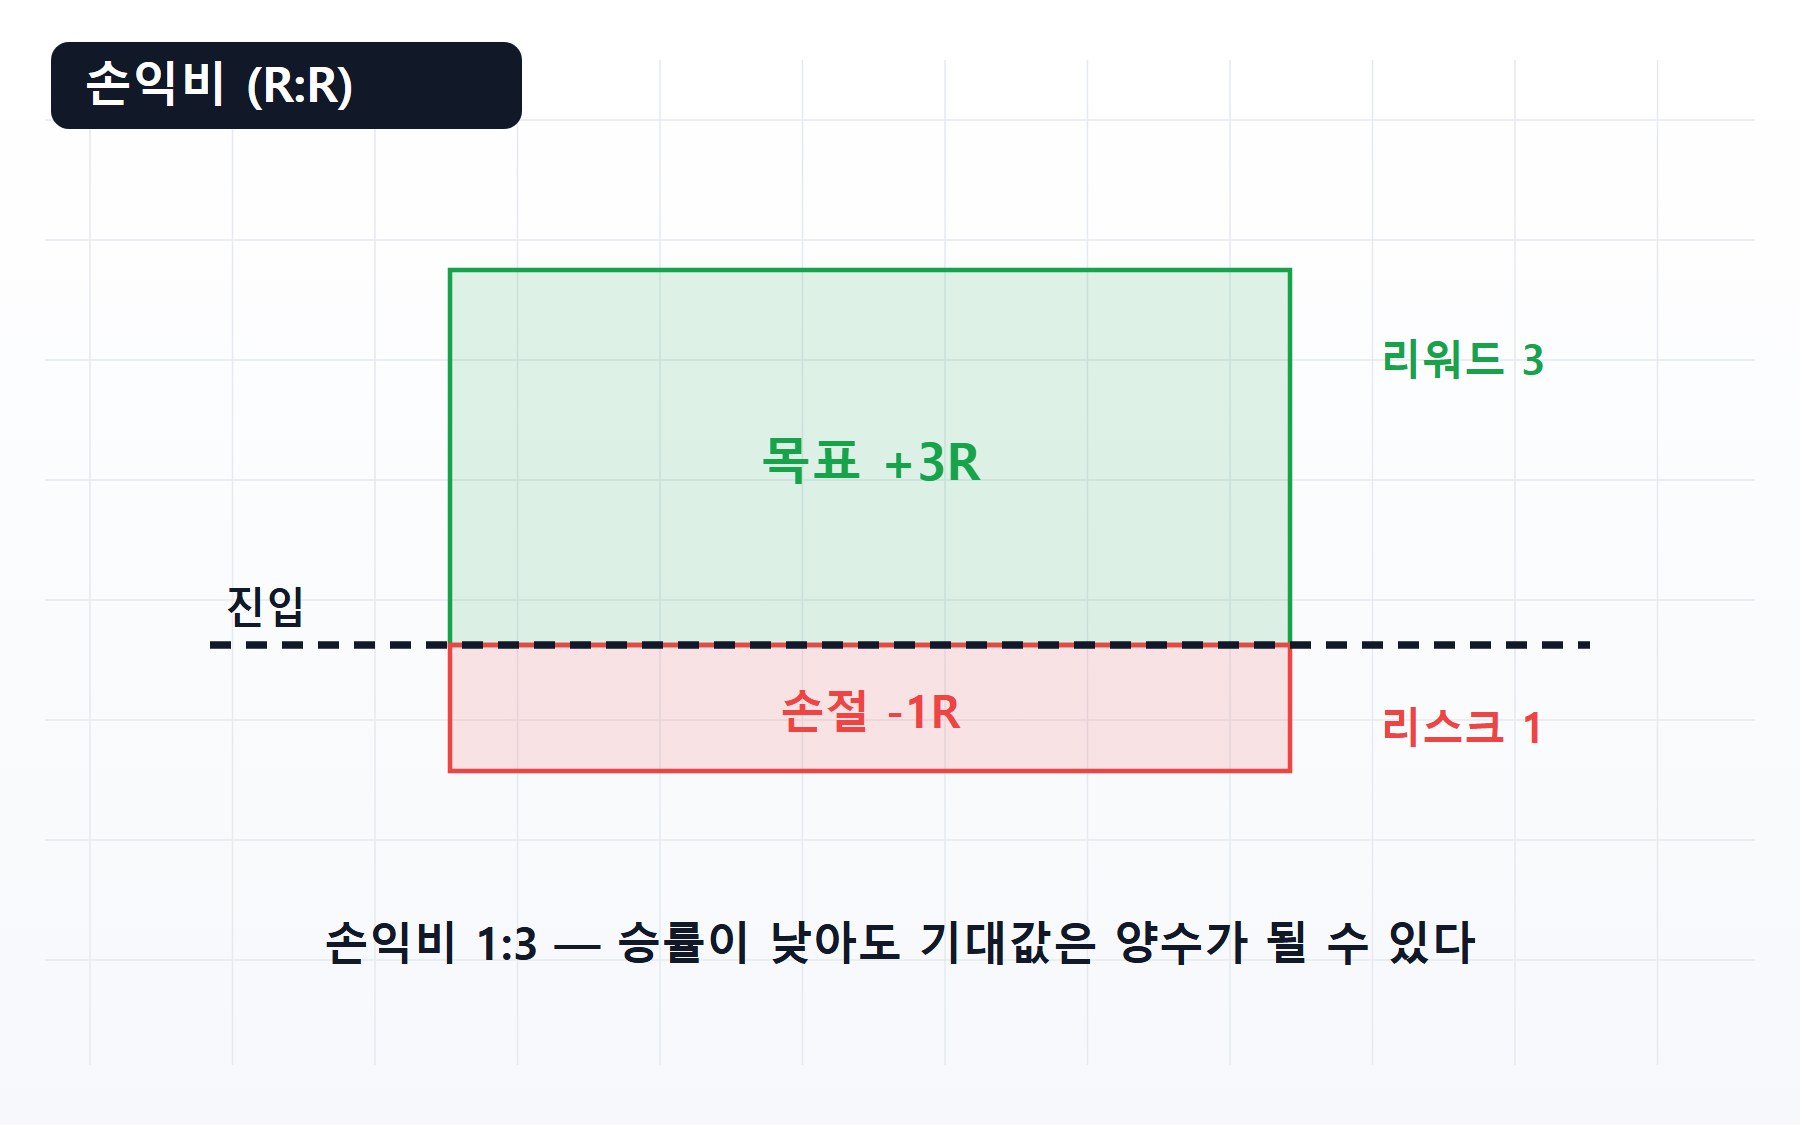
09 Risk-Reward and Expectancy — Risking 1R, How Many R Are You Aiming For?
From the definition of risk-reward (R:R) to the expectancy formula, worked through in numbers. The R arithmetic that keeps a ledger positive even when you're often wrong, the procedure for building the ratio into a setup — invalidation point first, then target — and where planned risk-reward leaks in practice.
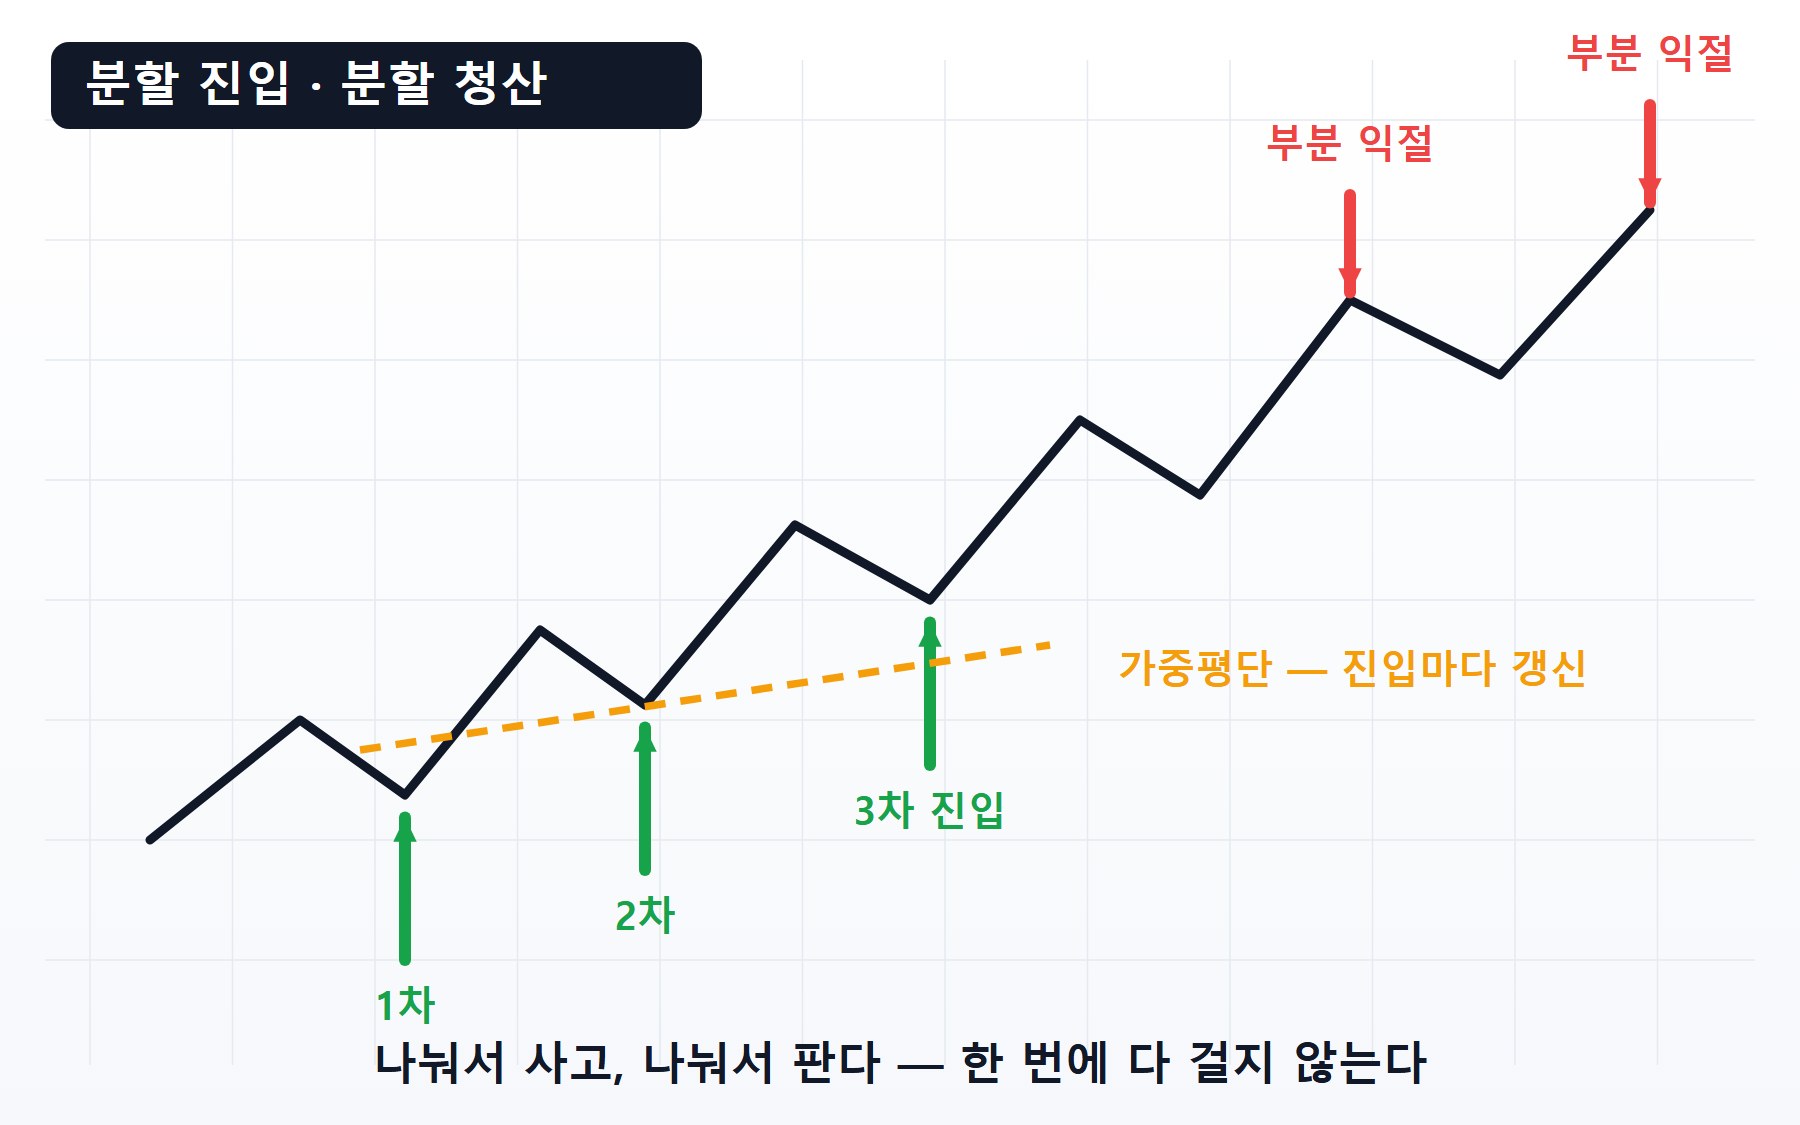
10 Scaling In and Out — Managing Your Average Price and Designing a Split Entry
From the math of scaling in to the rules for designing it: how your average price moves as a weighted average, the sequence for setting your zone, sizing, and invalidation, partial take-profit and trailing stops, and the decisive difference between averaging down and a planned split — all walked through with numeric examples.
🟡 Intermediate — Setups & tactics
Scalping, breakouts, trends — how proven setups work and where they fail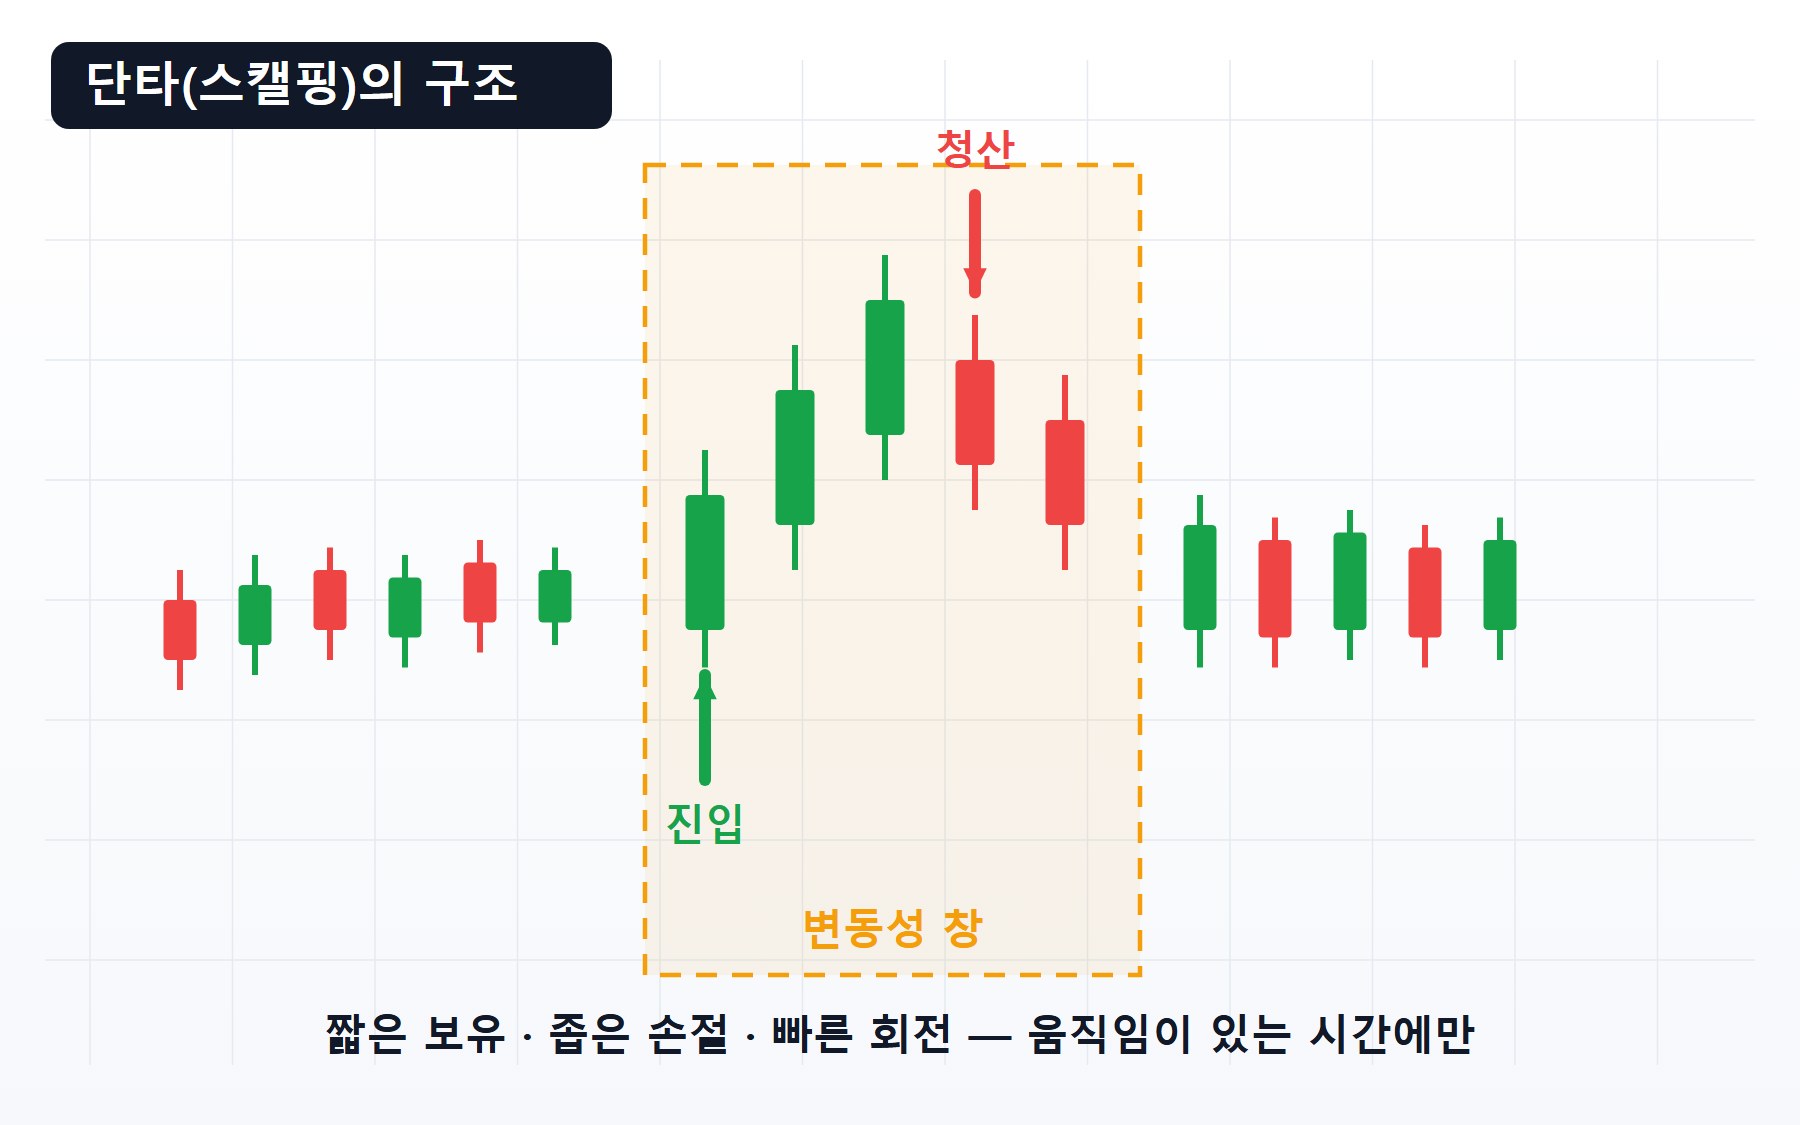
11 Crypto Scalping — A Game That Differs in Structure, Not Just Duration
Scalping, dissected as a structure: harvesting small edges quickly, over and over. Covers the hours when volatility clusters, three setups traders repeatedly observe, the fee math that decides the outcome, and the overtrading trap — organized as methodology.
12 Day Trading Setups — Condition, Entry, Invalidation, and Target
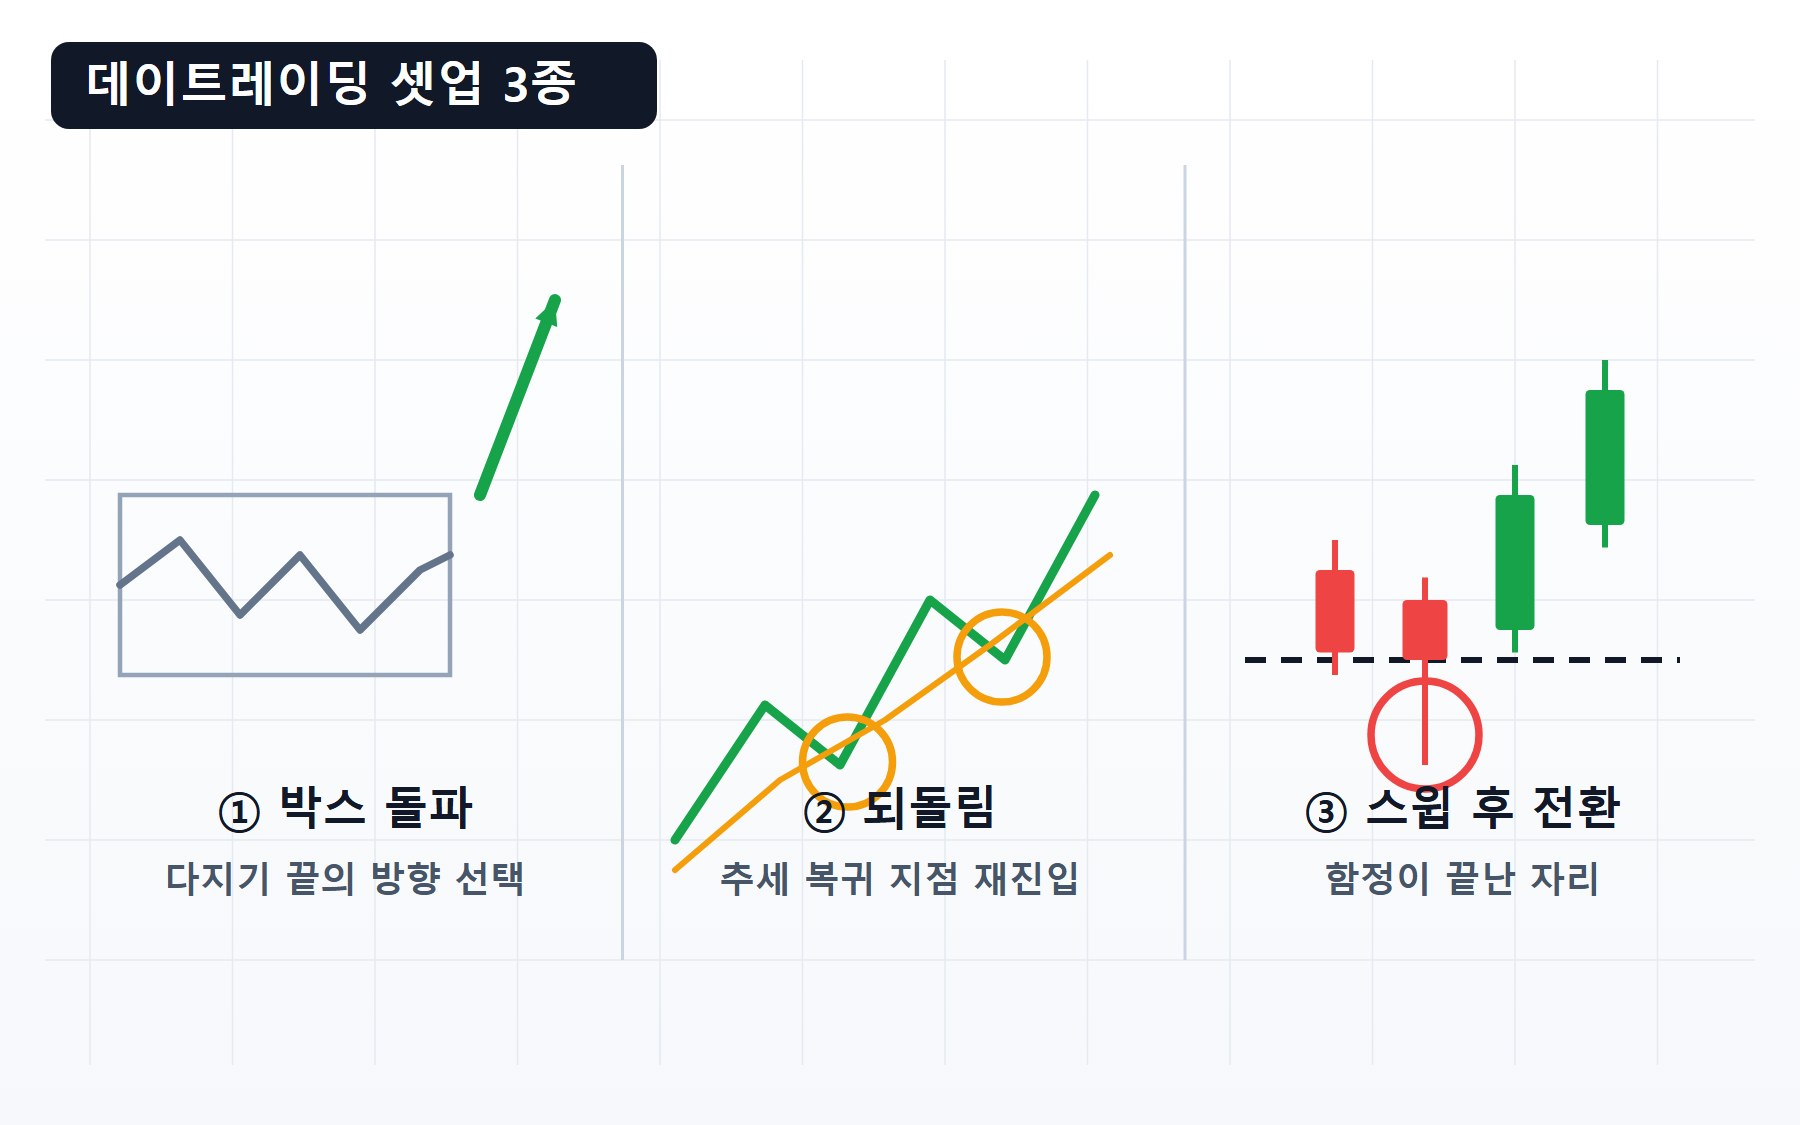
The core of day trading isn't a list of techniques — it's the framework of the setup. We break range breakouts, trend pullbacks, and sweep-and-reclaim reversals down into four components — condition, entry, invalidation, target — and walk through the process of turning a setup into an asset through record-keeping.
13 Volume Profile — Reading Volume Nodes Through the Distribution of Traded Volume by Price
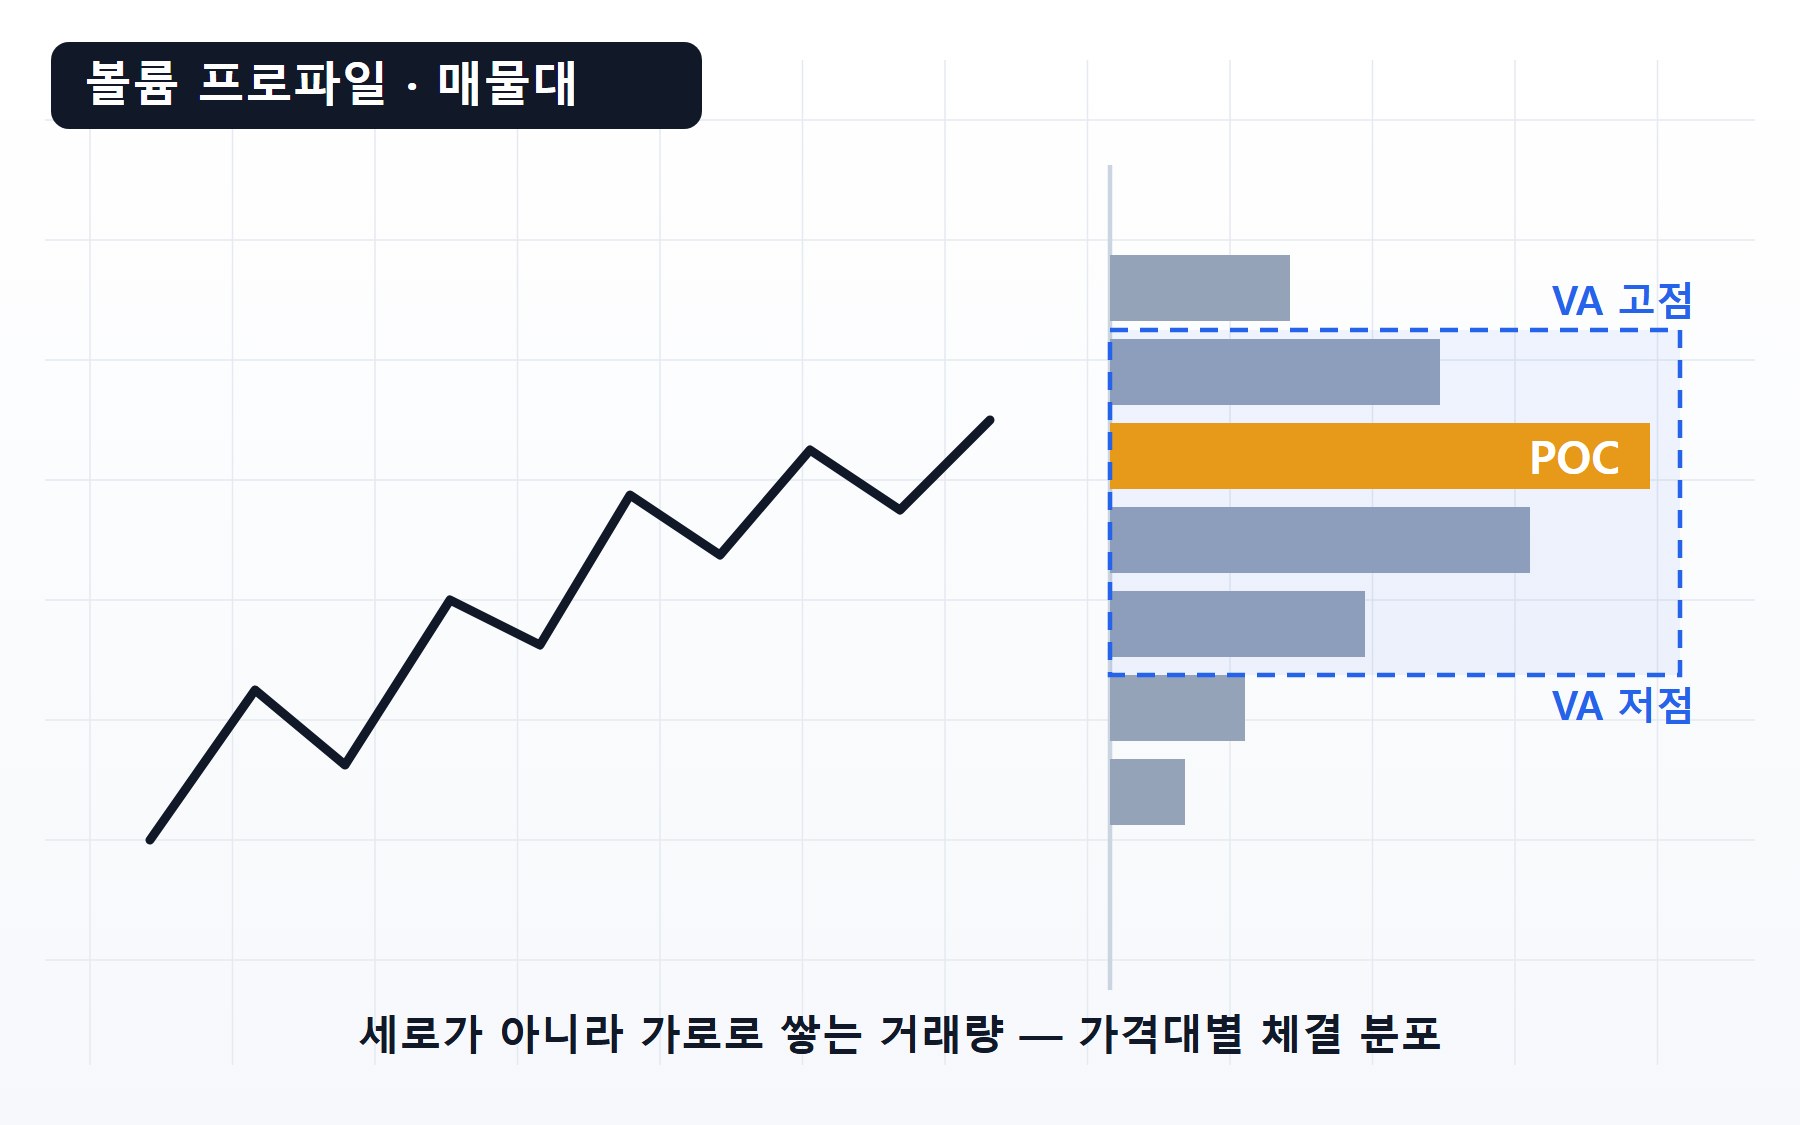
How to read Volume Profile, which stacks volume on the price axis. From the definitions of POC, Value Area, HVN, and LVN to the 'nodes are magnets, gaps are corridors' interpretation, the range-selection-to-target workflow, and the tool's lagging-data limits.
14 Breakout Trading and VCP — Measure the Contraction, Draw the Pivot, Define Invalidation First
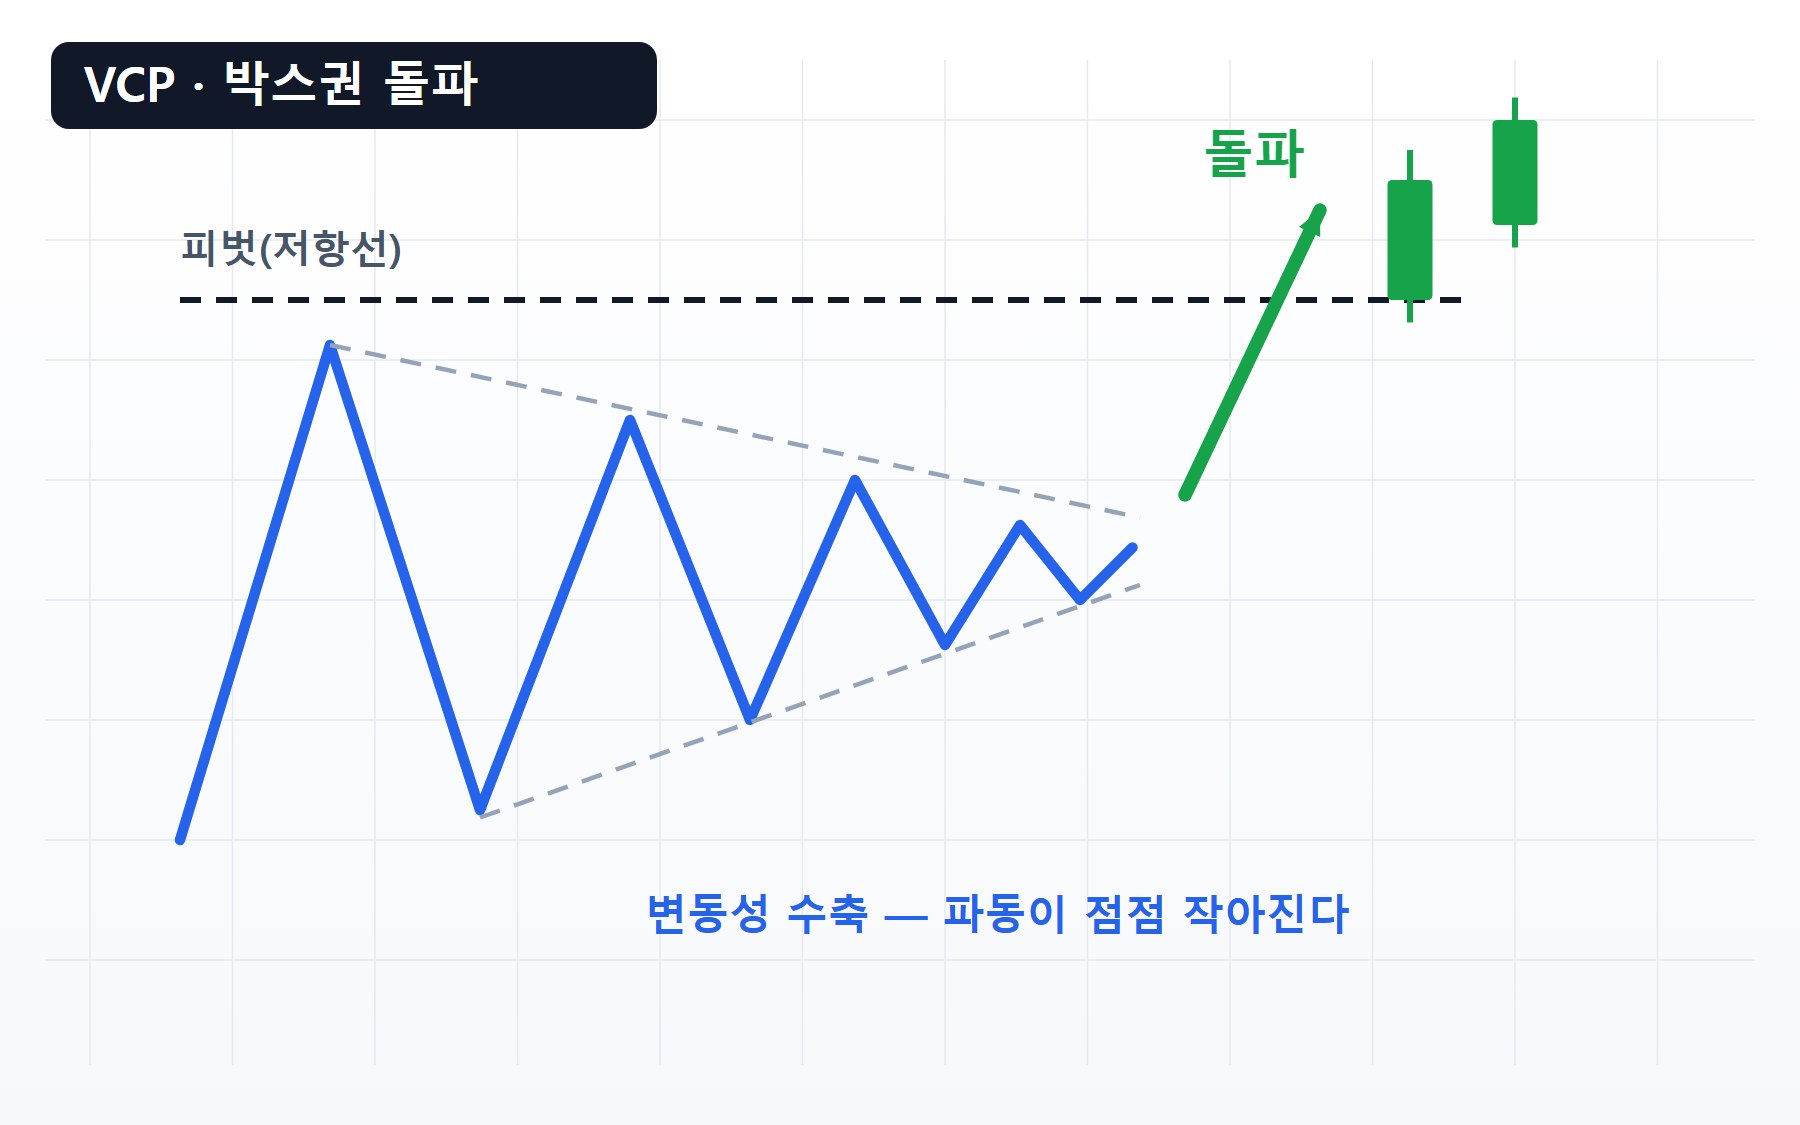
A dissection of breakout trading as a volatility contraction-then-release structure. It lays out Minervini's VCP contraction rules (count, depth, volume), three pivot entry methods, five false-breakout filters, and a three-stage invalidation framework — all organized as procedure.
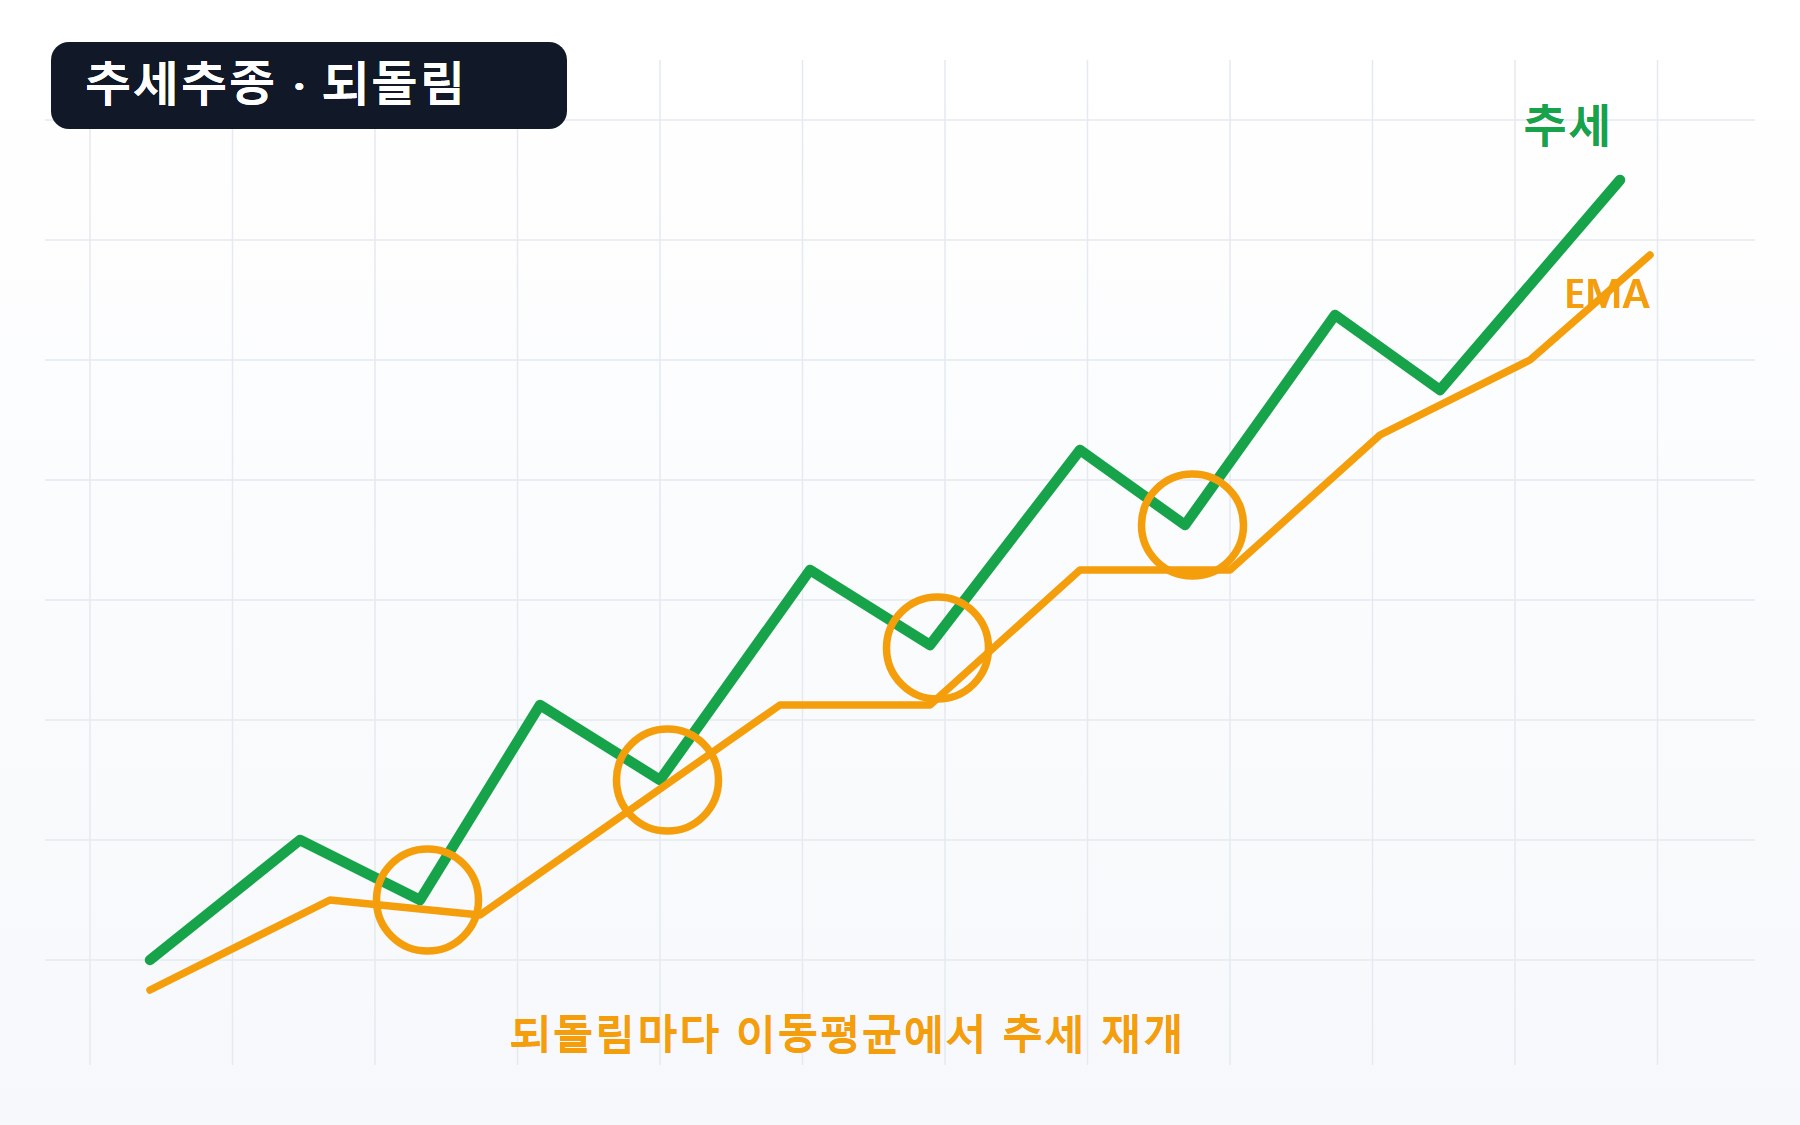
15 Trend Following — Trading Where the Rules Are Everything: Turtle Rules, Trend Identification, Pullback Entries, Invalidation
Rules instead of predictions — a dissection of the Turtle rules' entry, 2N stop, pyramiding, and exit structure with real numbers, plus a methodical walkthrough of trend identification, pullback entries, and invalidation criteria — including the whipsaw losses a ranging market inflicts, hidden nowhere.
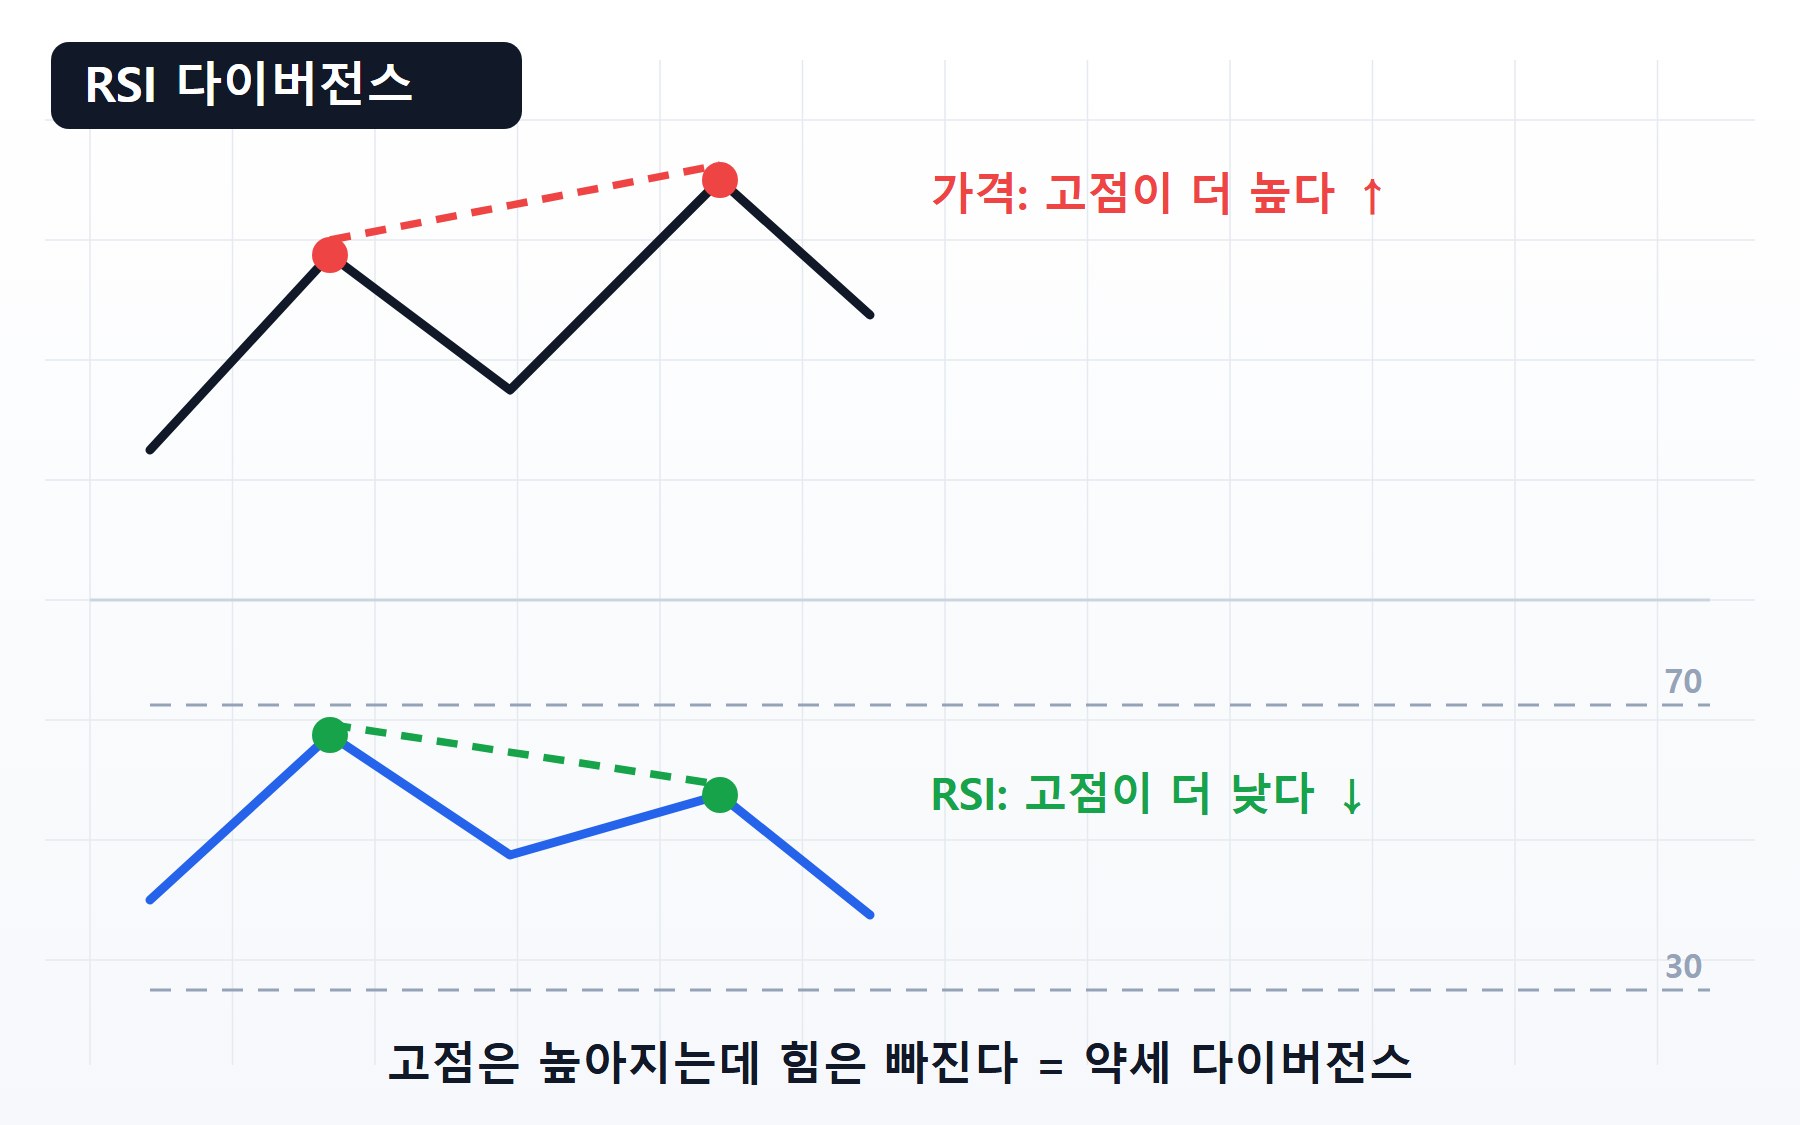
16 RSI Divergence — Reading the Moment the Speedometer Rolls Over First
When price prints a new high but RSI can't keep up, that's circumstantial evidence the force is running out. This piece lays out the methodology of divergence — a 6-step rule set for pairing swing extremes, the four regular and hidden combinations, invalidation criteria, and how to combine confirmation signals.
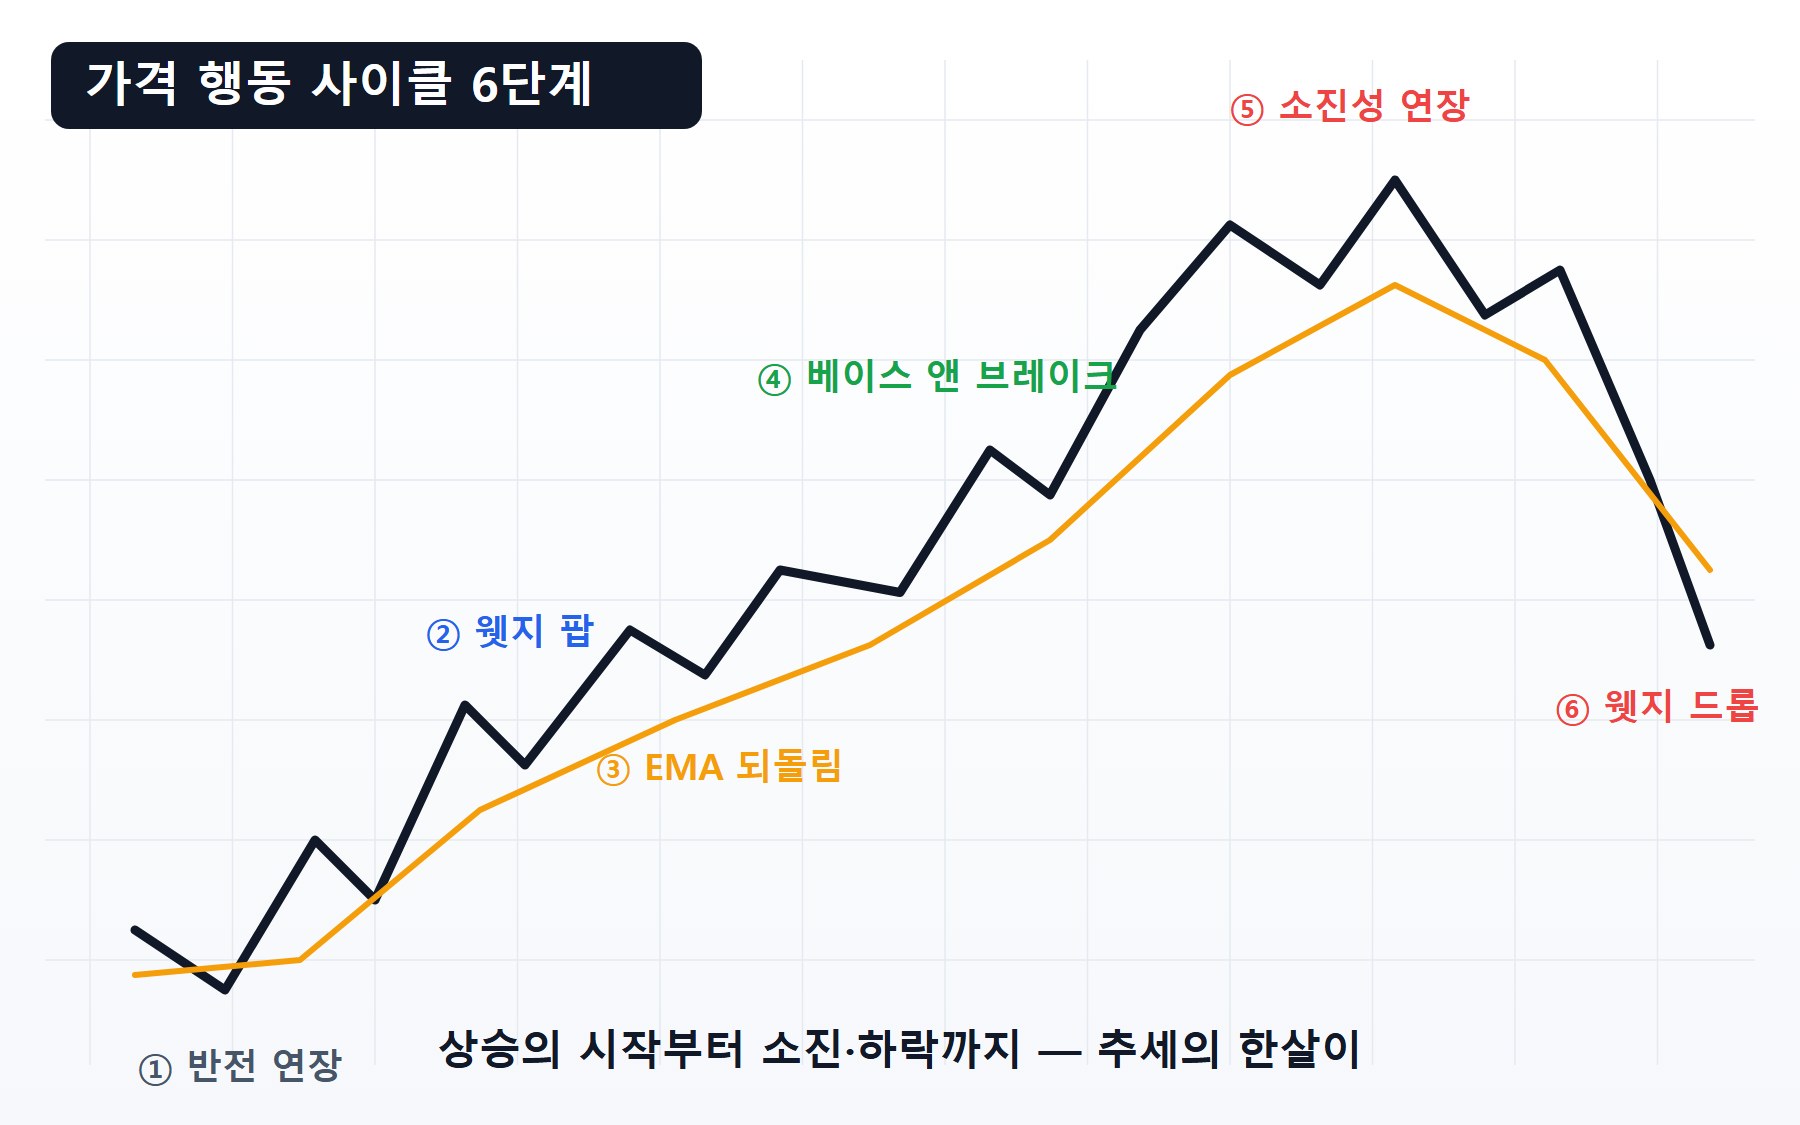
17 Oliver Kell's Cycle of Price Action — How to Tell Which Stage You're In
A stage-identification breakdown of the six-stage Cycle of Price Action from Oliver Kell, the 2020 US Investing Champion. Chart criteria and invalidation levels for each stage, a worked R calculation, and what changes when you carry this stock-based framework into the 24/7 crypto market.
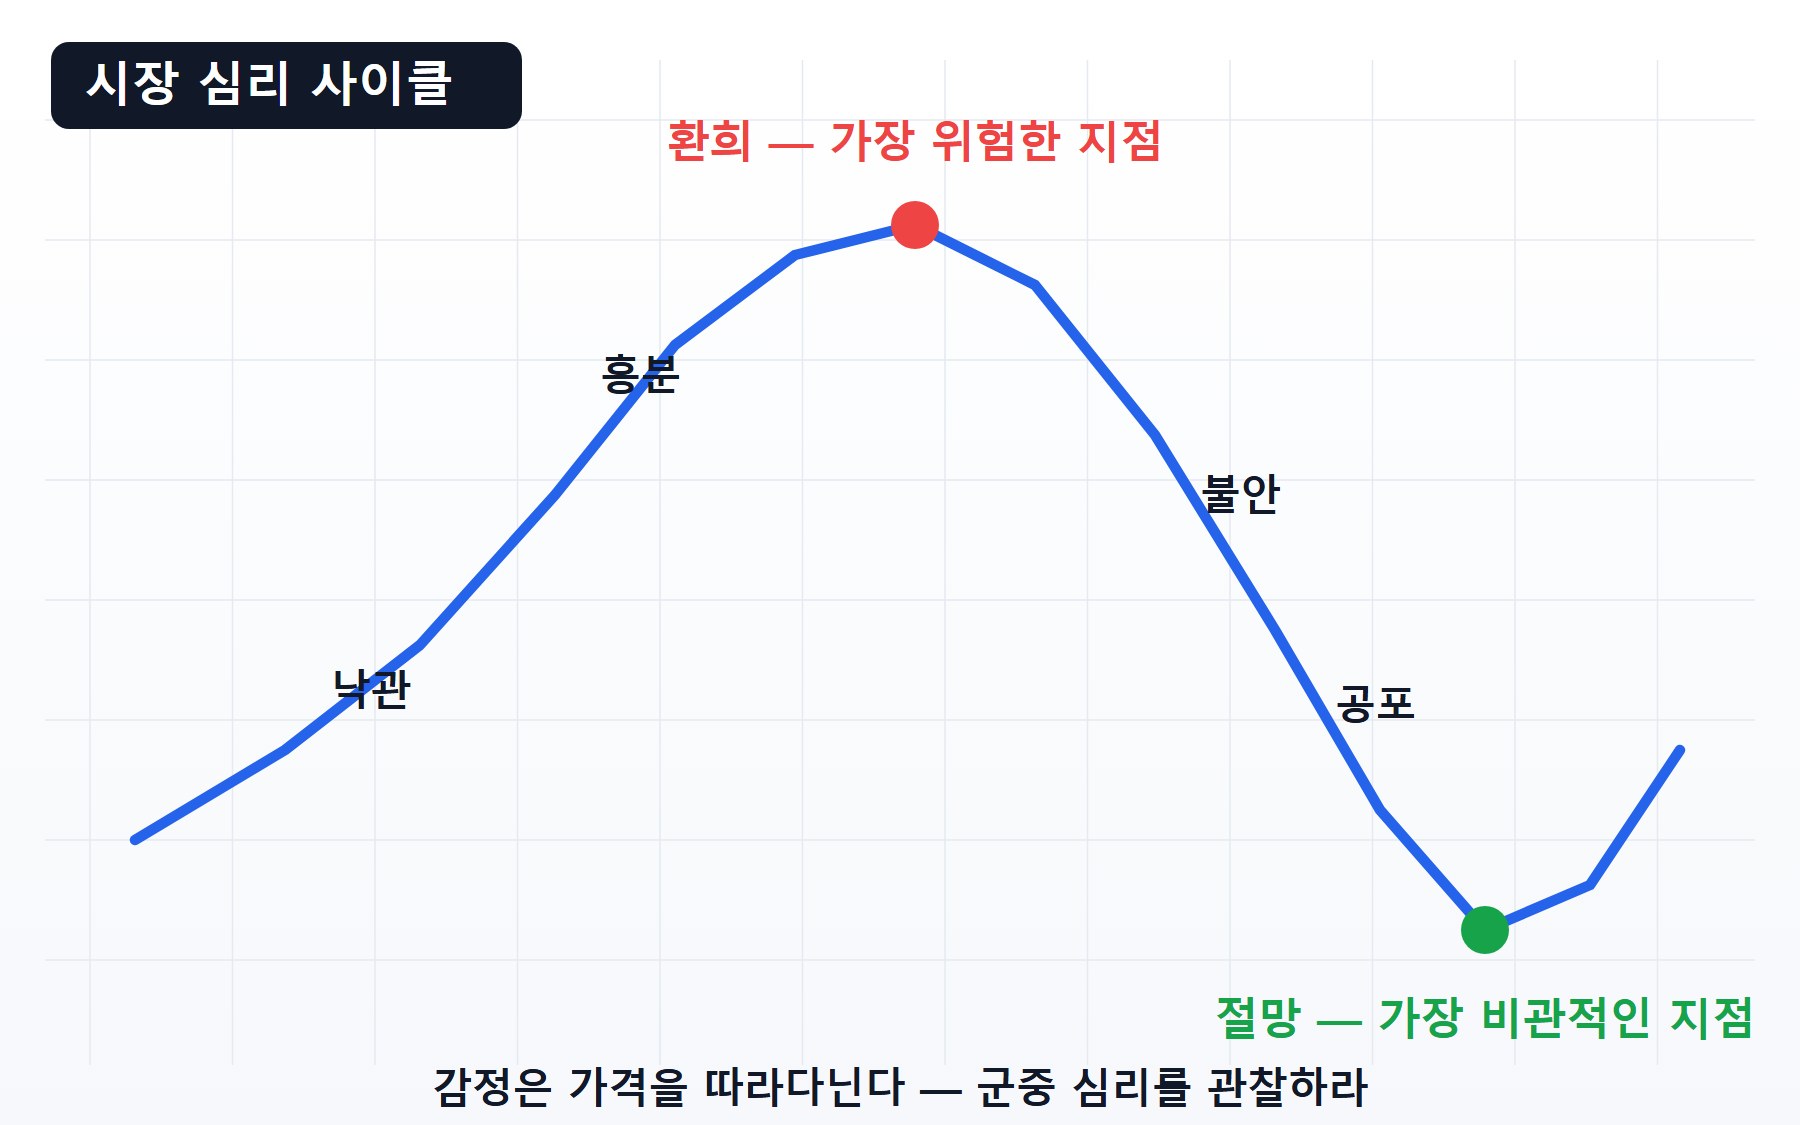
18 Trading Psychology — Replace Willpower with Procedure
FOMO, impulse trading, and delayed stop-losses don't get fixed by willpower. A procedure-first guide covering the math of loss aversion, how the three account destroyers operate, rule design that replaces emotion, and how to run a trading journal.
19 The Trading Journal — Your Edge Shows Up Only in Your Own Data
The advice to "keep a journal" is everywhere, but the what and the how are always left blank. Here is an actionable methodology: a field schema covering entry rationale, planned R versus actual fill, and adherence grade; a weekly and monthly review routine; and process metrics that track rule adherence rather than P&L.
🔴 Advanced — Whales & market structure
Whales, liquidity, derivatives — the game behind the price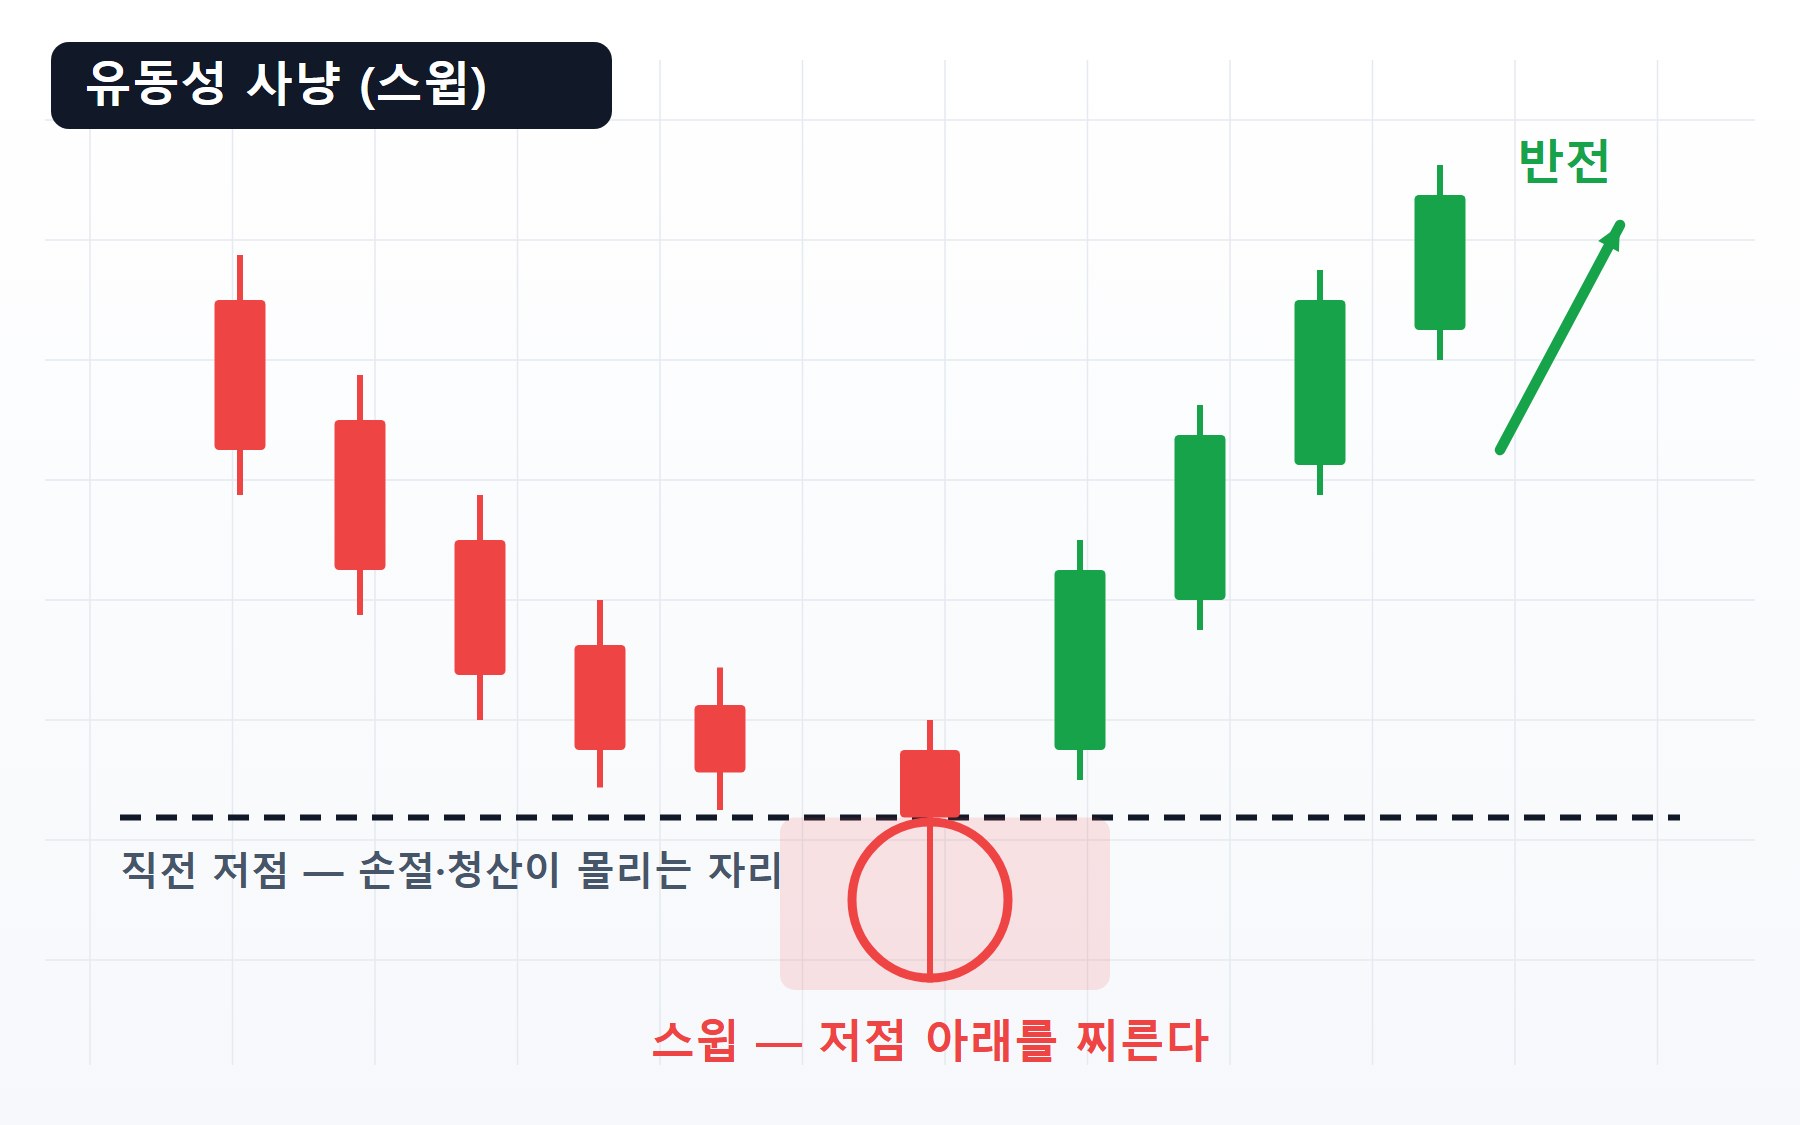
20 SMC Trading Dissected — Selection Rules for Order Blocks, Liquidity Sweeps, FVG & BOS/CHoCH
A chart-procedure dissection of SMC trading: the rules for designating order block and FVG candidates, the three conditions of a liquidity sweep, reading BOS/CHoCH, and where invalidation sits — plus how to cross-check the liquidity map against measured whale liquidation prices, and the reproducibility debate.
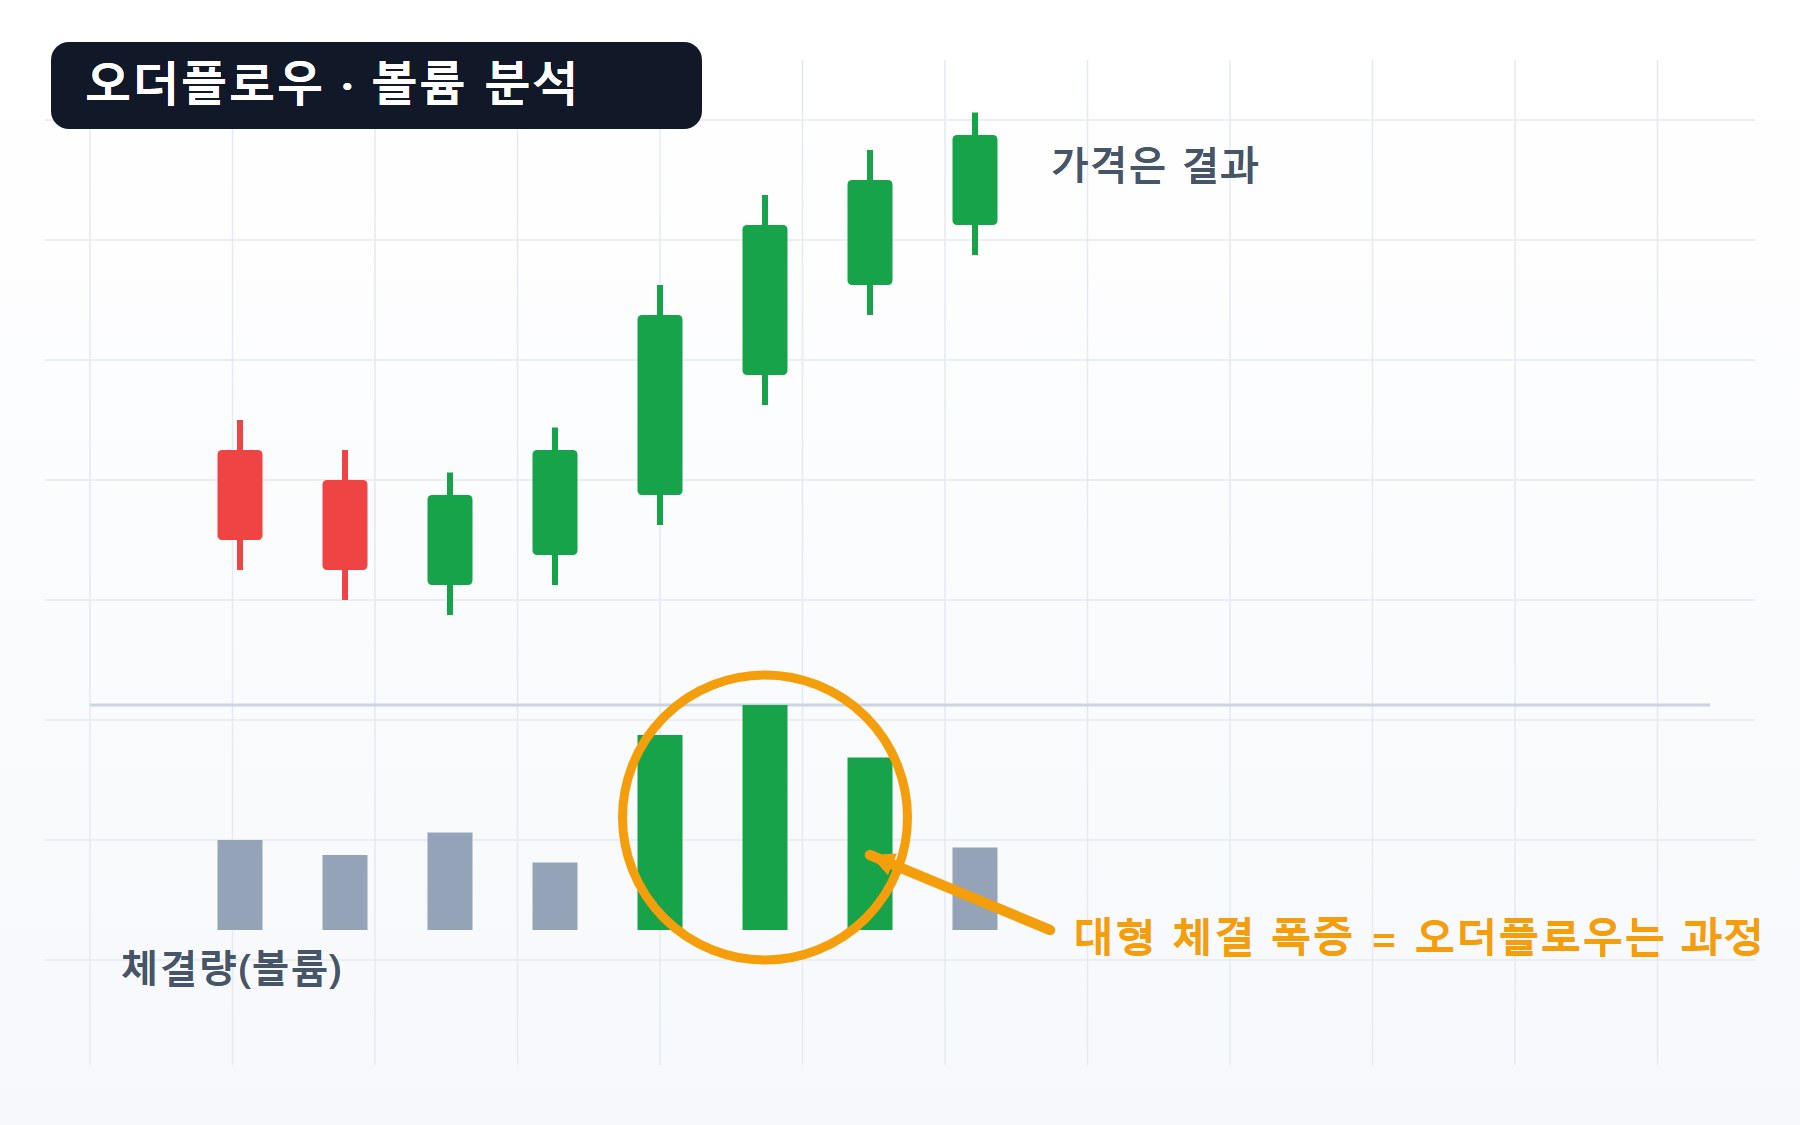
21 Order Flow & CVD — How to Read the Trades Behind the Candle
From how CVD (Cumulative Volume Delta) is computed, to the four-quadrant procedure for reading price against CVD, the three conditions for calling absorption with the R math, and the traps of spoofing and per-exchange data quirks. Turning trade-flow analysis into a step-by-step methodology.
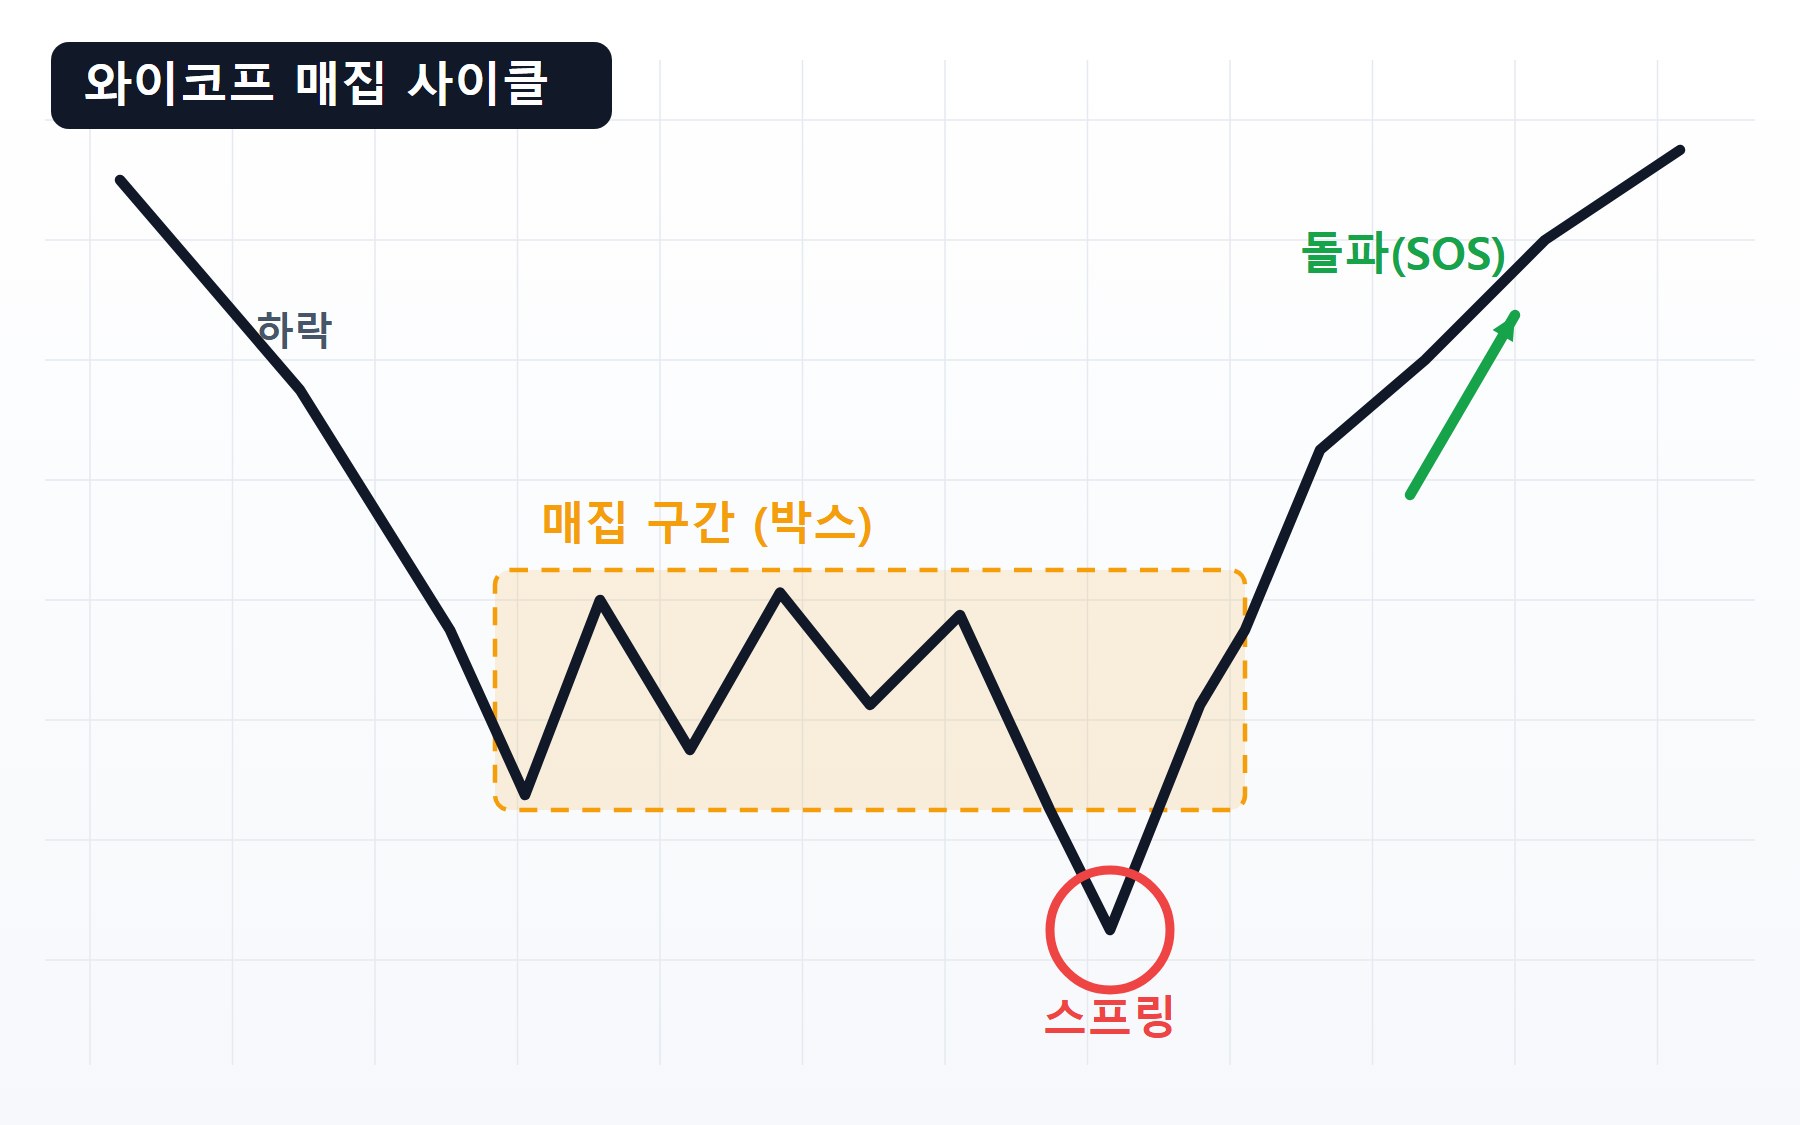
22 The Wyckoff Method — Accumulation/Distribution Schematics, the Spring, and the Event Identification Procedure
Wyckoff accumulation and distribution, organized as an identification procedure. The order for confirming PS, SC, AR, ST, spring, and SOS events, invalidation criteria, worked numbers, the relationship to SMC, and the bridge to on-chain measurement.
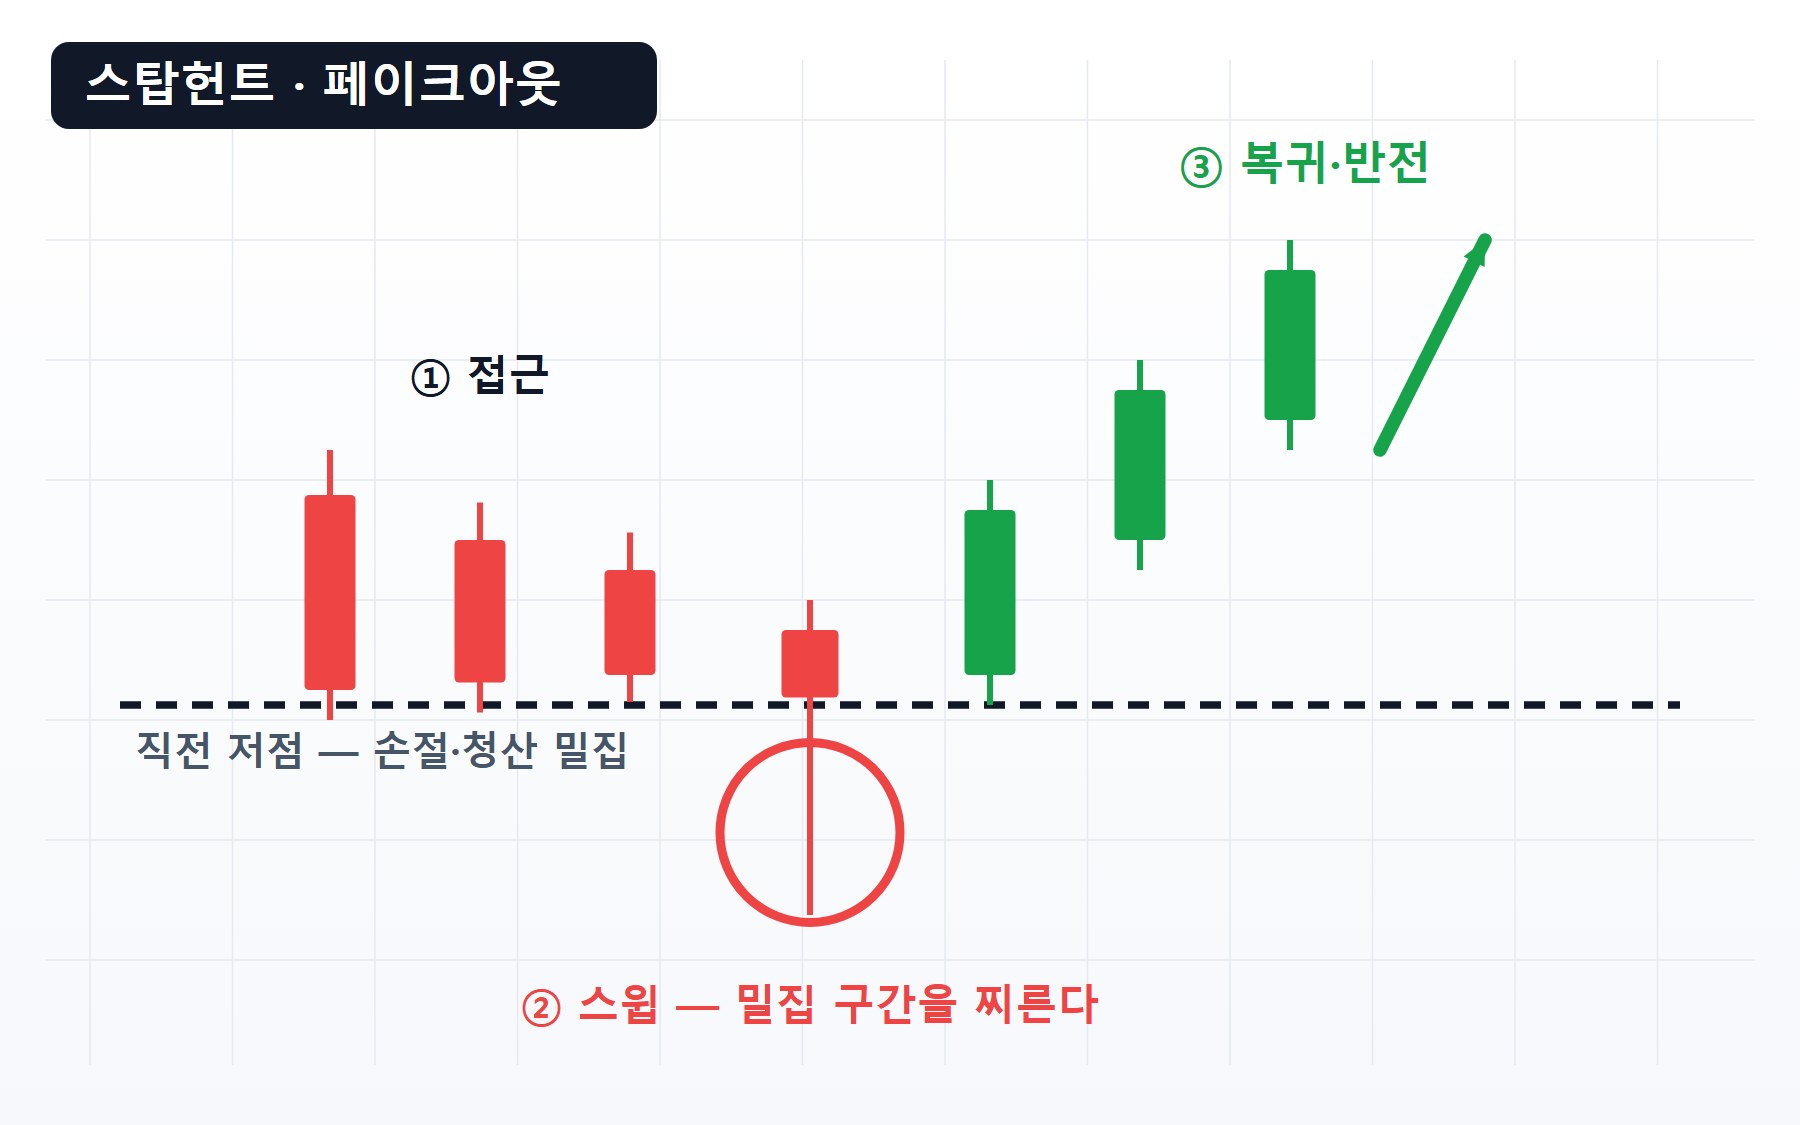
23 Stop Hunts — The Anatomy of Stop Runs and How to Spot Fake Breakouts
A structural breakdown of the move that tags your stop and then runs the other way. The three phases of a stop hunt, a real-vs-fake breakout checklist, stop placement design, and the sweep-and-reclaim setup — plus how to map the hunting ground in advance with real liquidation-price data.
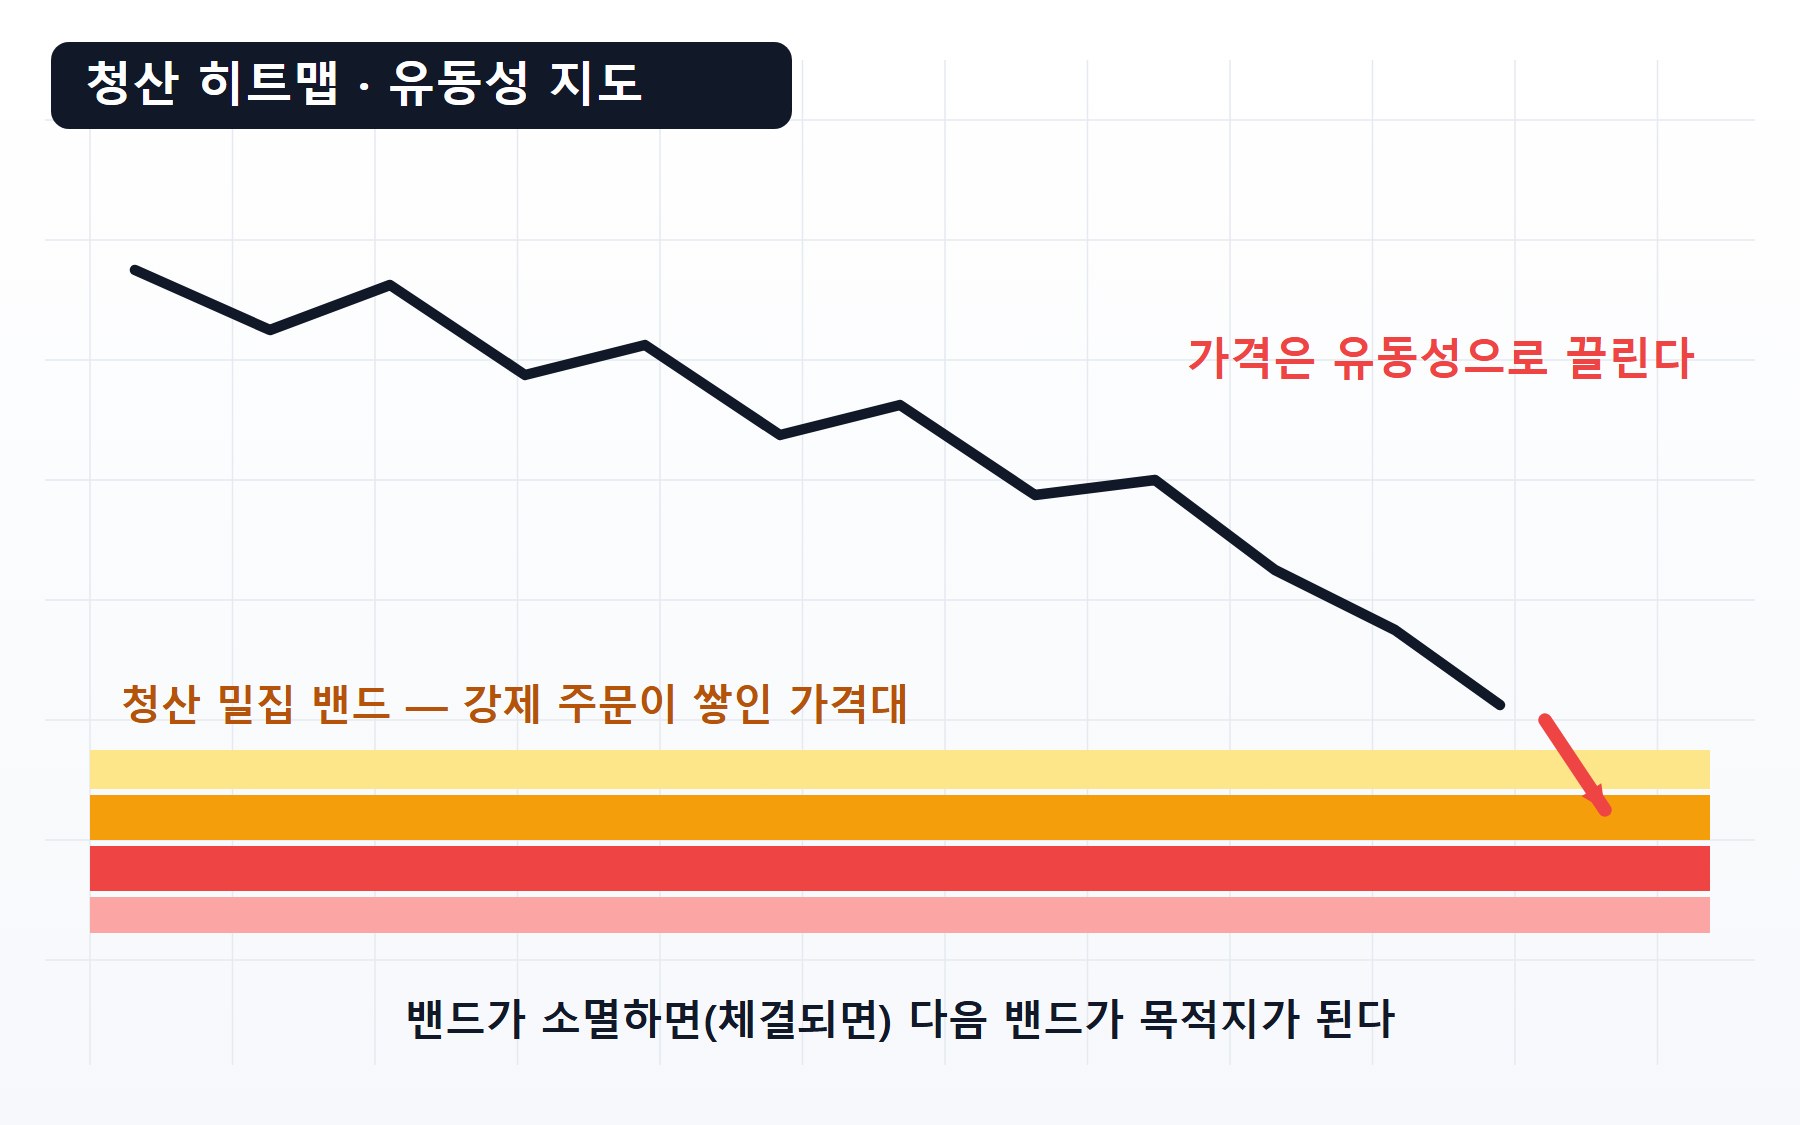
24 Liquidation Heatmaps — How to Read Liquidity Magnets and the Liquidation Map
What a liquidation heatmap actually is (a density map of estimated liquidation prices), why the magnet effect works, and a step-by-step procedure for reading how bands form and disappear. Covers the tool's core limitation — it's all estimates — the self-fulfilling-prophecy debate, and how to cross-check against real, observable liquidation prices.
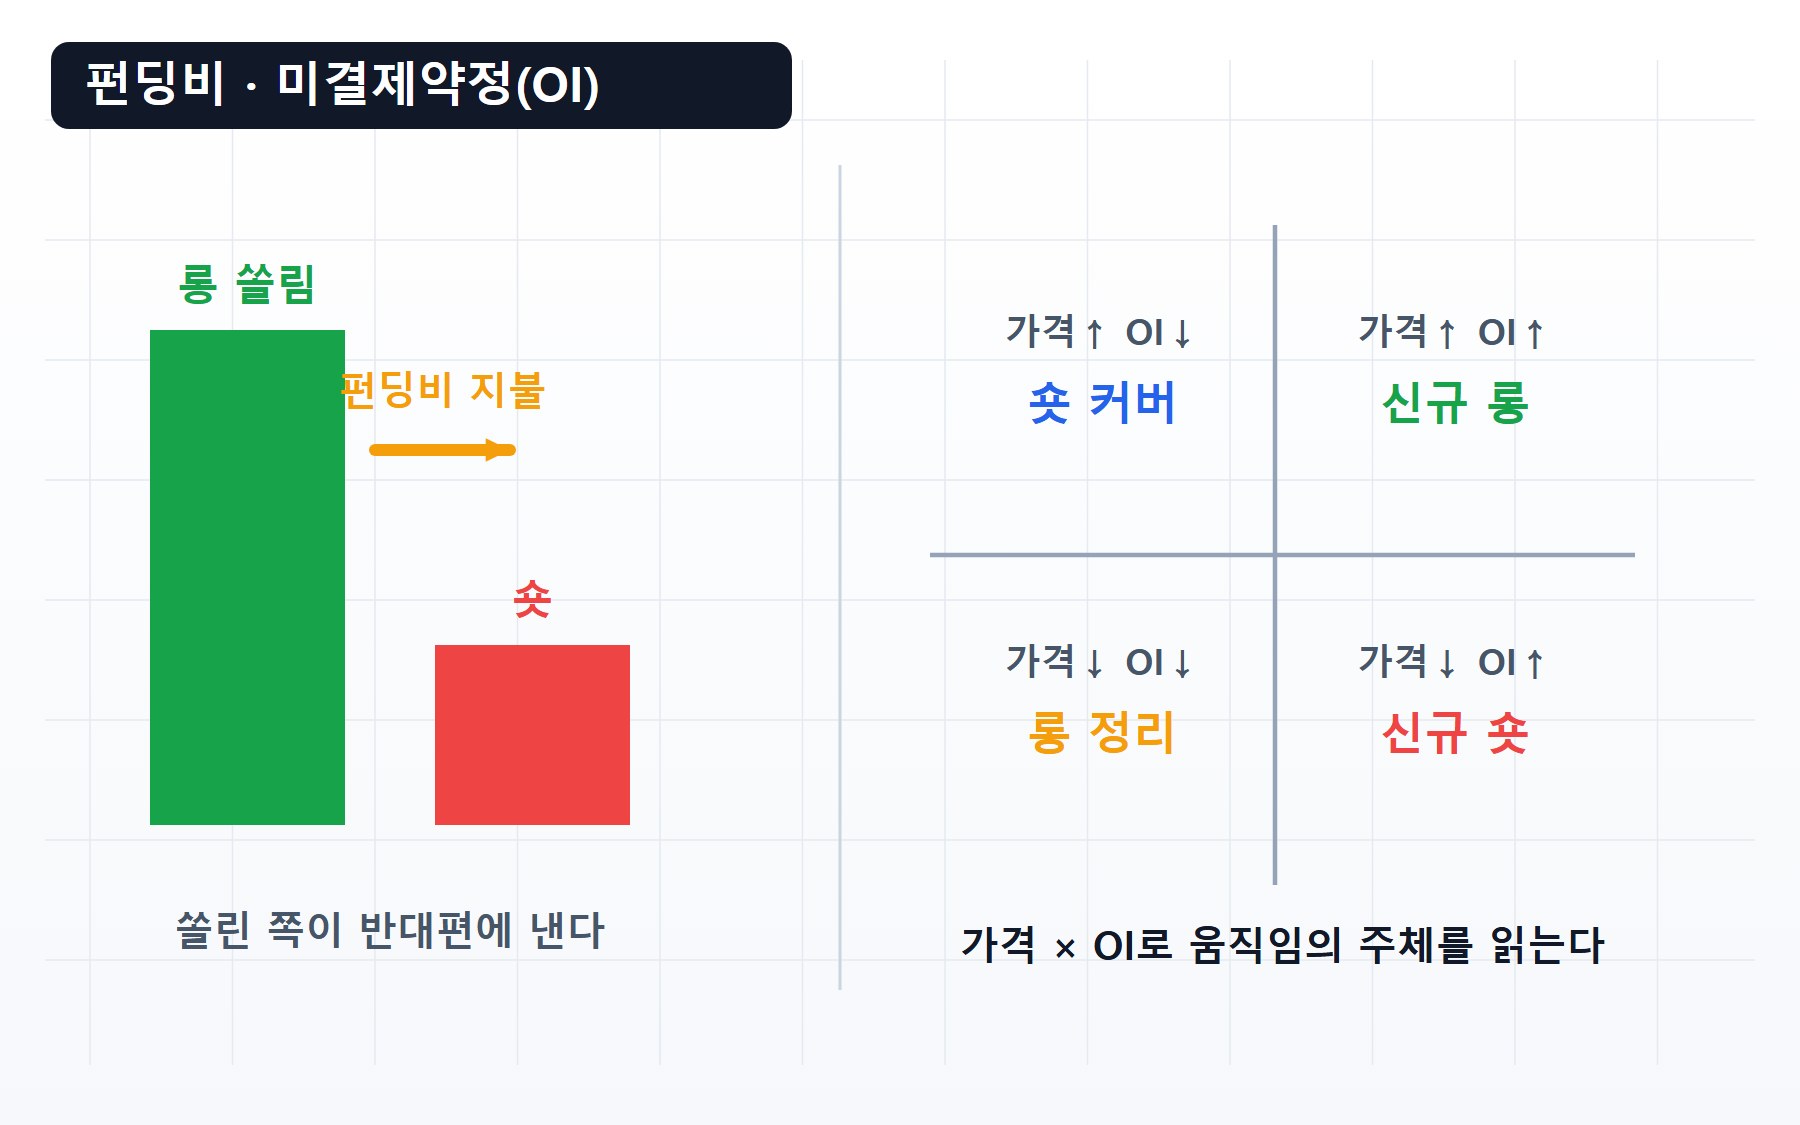
25 Funding Rates and Open Interest (OI) — Reading the Derivatives Market's Two Thermometers
From who actually pays whom via funding and what open interest (OI) really counts, to the price-times-OI four-quadrant reading grid, how extreme funding becomes squeeze fuel, and a pre-entry check routine.
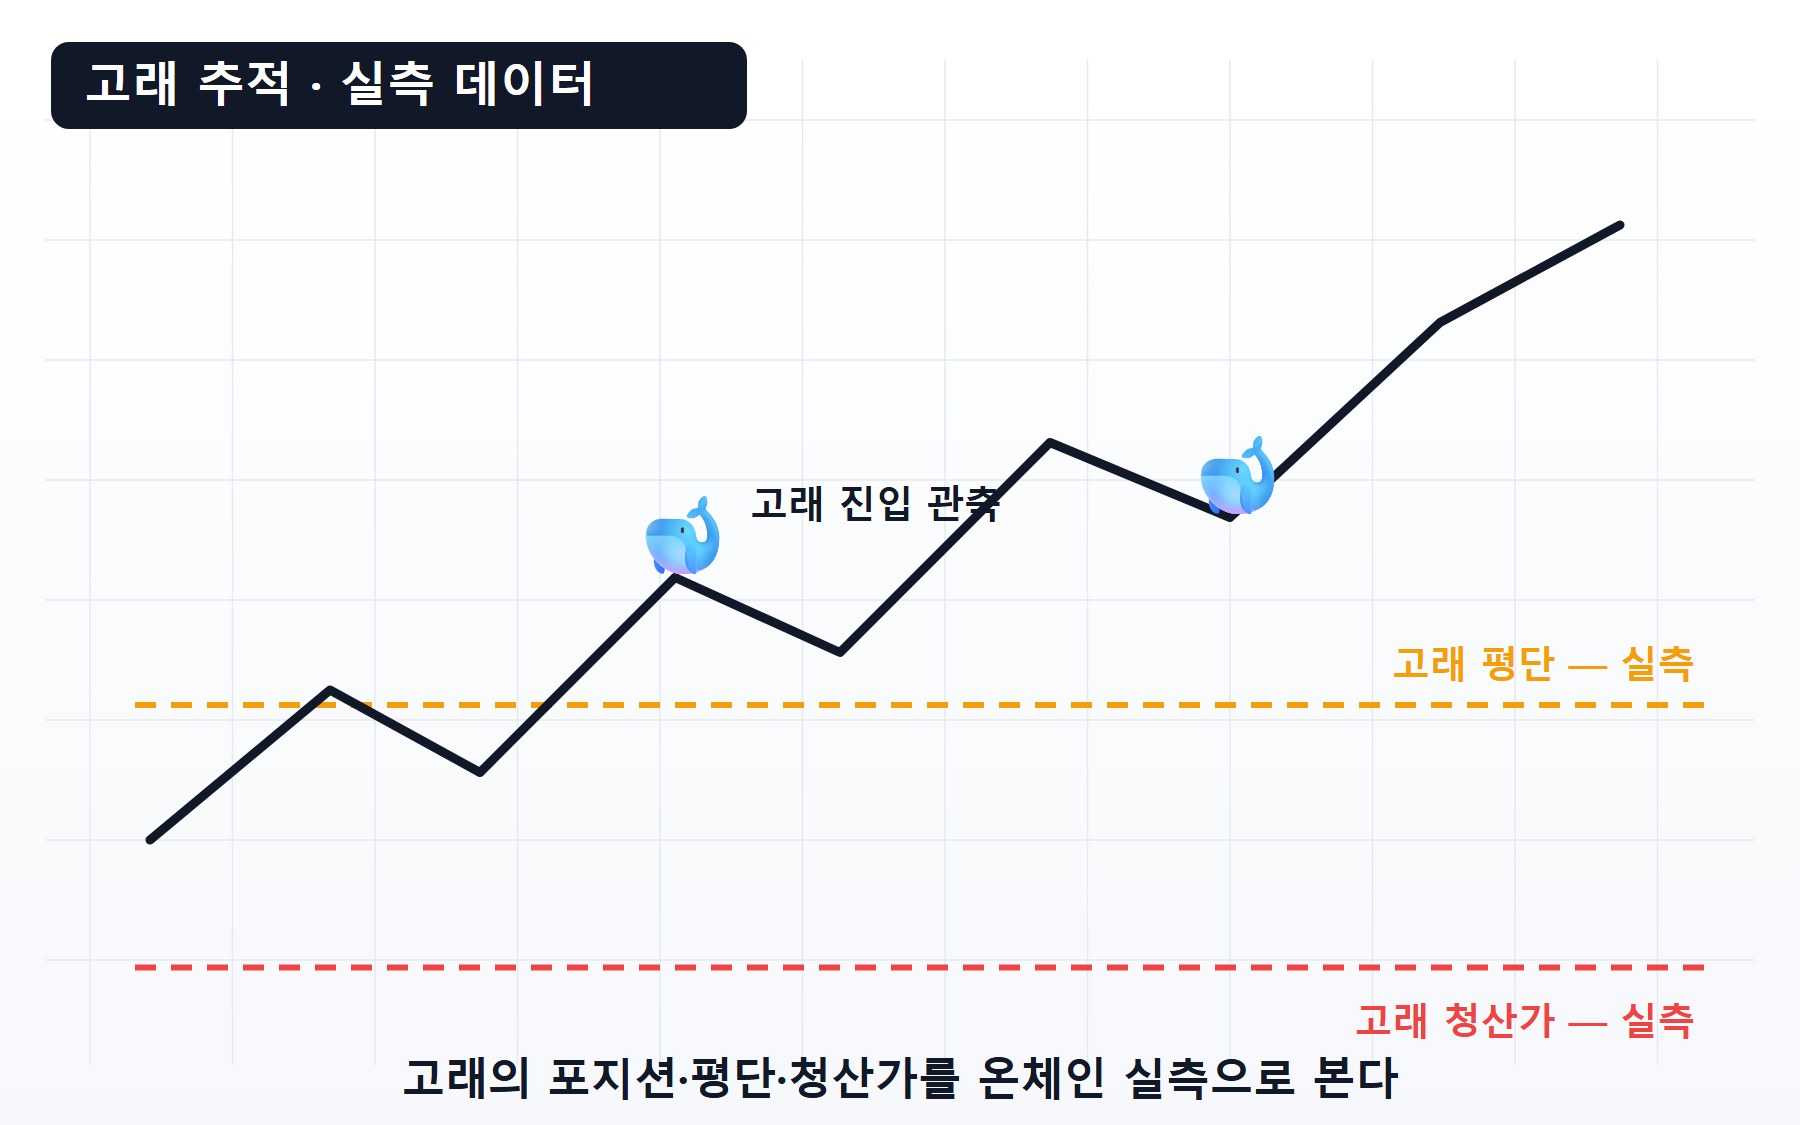
26 The Whale Playbook — How to Read Whale Data
Survival patterns confirmed in Hyperliquid whale wallet data, the triple gap (lag, size, purpose) that makes copy-buying fail, and a step-by-step procedure for reading levels, crowding, and change.
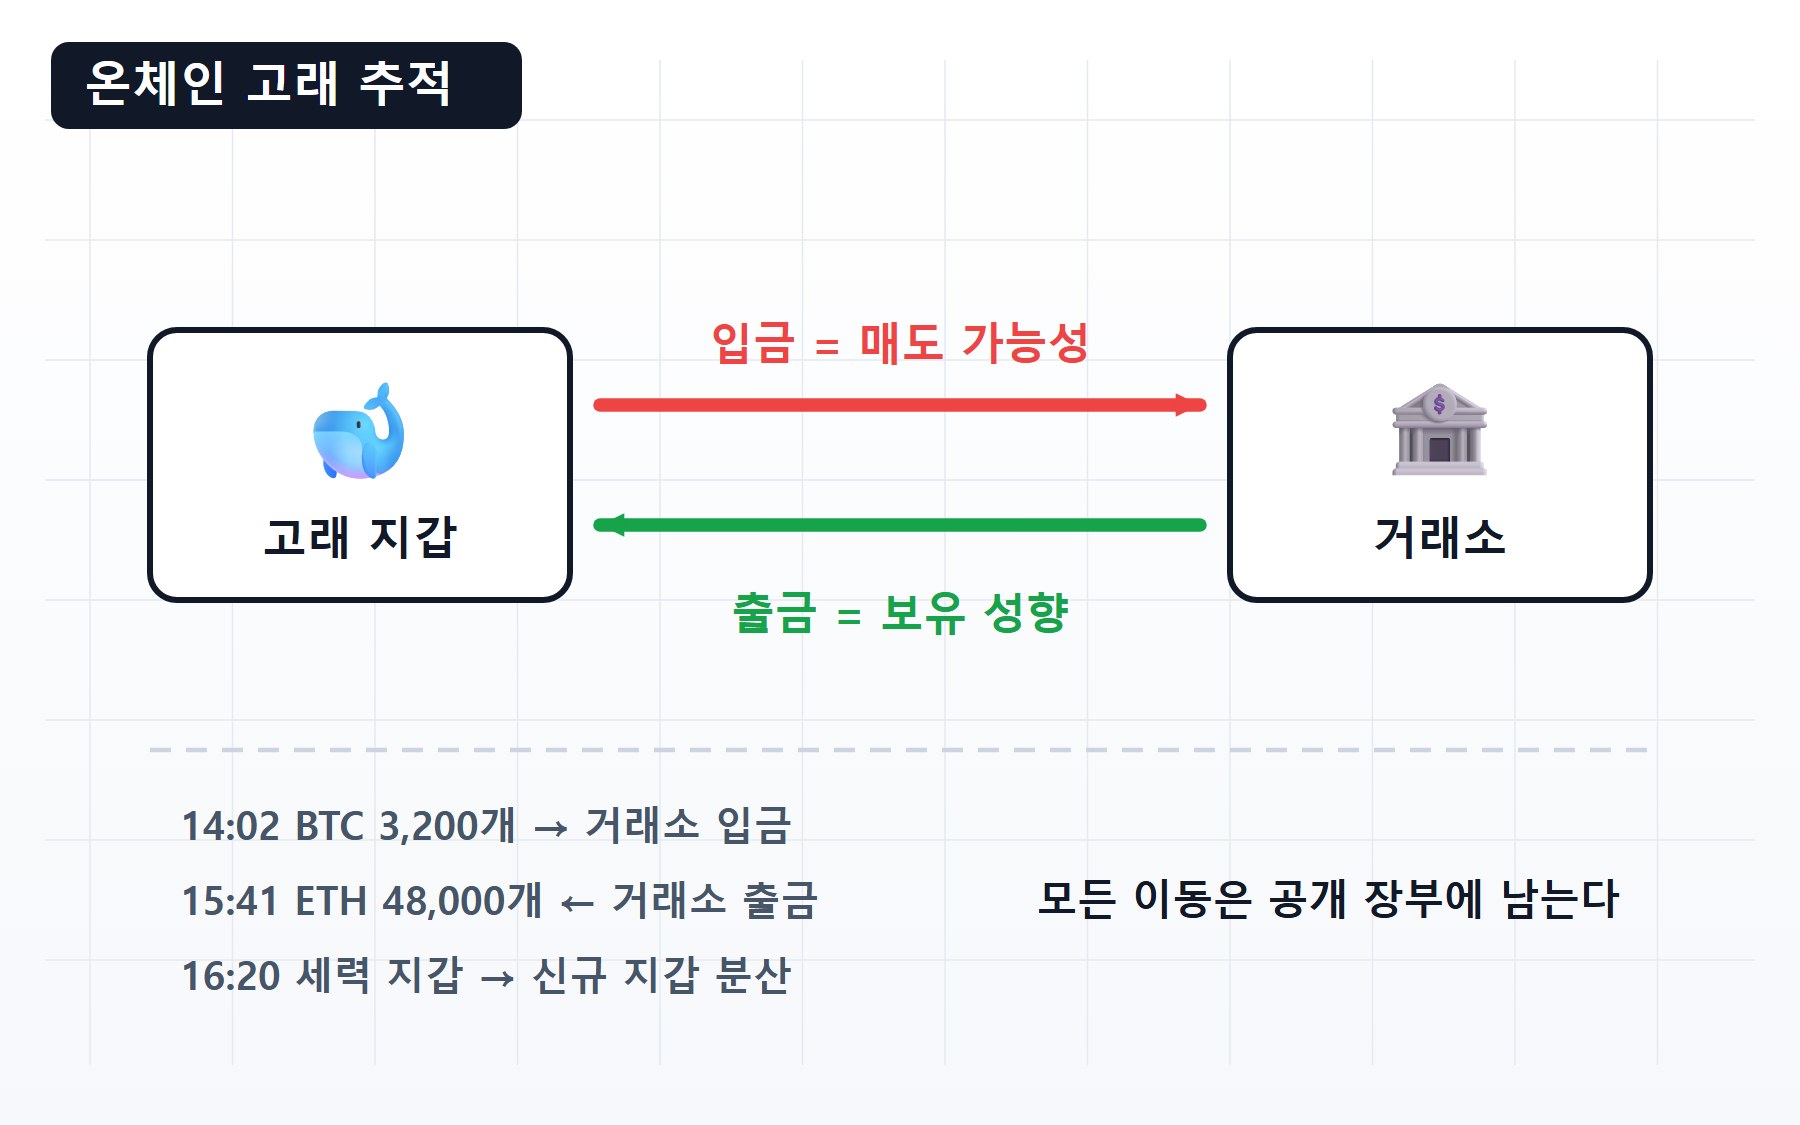
27 On-Chain Whale Tracking — A Methodology for Netflow, Smart-Money Wallets, and Signal Reading
How to interpret exchange netflow, how smart-money wallets get labeled and cross-verified, and a step-by-step procedure for reading moves by amount, actor, and destination — the methodology of on-chain whale tracking, plus the false-positive traps like internal transfers and label errors.
28 Your Trading System on One Page — Scattered Rules Into a Single Plan
Turn the pieces you've learned into a single page — bind market, setups, 1R, and routine into a verifiable trading plan, then walk through a worked example that seats the Kell Cycle into it, plus a self-check checklist.
🏆 Champions Playbook
All champions →Scan famous techniques by their one-line core rule — one champion, one card.
🏆 Case studies
Public records · on-chainWhat champions did, and what blew accounts up — seen through public, real cases.

Oliver Kell
Winner of the 2020 U.S. Investing Championship (sub-$1M division) — a rule-based trader who put his six-stage 'Cycle of Price Action' and his stop-first discipline out in the open
The White Whale
How an anonymous trader's 30-day +$45.8M actually gets verified, and why the very same 'ride-it-out' structure can just as easily end in the opposite outcome.
James Wynn
How a fully on-chain, extreme-leverage mega-long came apart when the market turned lower — read through the arithmetic of leverage and the mechanics of exposure
Qwatio
How an anonymous Hyperliquid whale was liquidated over and over fighting BTC's all-time-high rally — the anatomy of a blow-up, reconstructed from the public record
Alpha Arena (Nof1)
Reading research lab Nof1's AI trading experiment as structure rather than story — the real variable that split the results of six models starting from the same capital and the same market
New to the terms?
Start with the basics: What is a whale? · What is a liquidation? · What is funding rate? · What is Hyperliquid?
🐋 See the live whale tracker →Hero photo: Oliver Tsappis / Unsplash · In-article charts: TradingView