The Wyckoff Method — Accumulation/Distribution Schematics, the Spring, and the Event Identification Procedure
Published 2026.07.03 · Updated 2026.07.06
Most people searching for the Wyckoff method want two things — a way to tell whether the range they're staring at is accumulation or distribution, and the precise meaning of terms like 'spring.' This piece is not a history lecture on a hundred-year-old theory; it's an identification manual. It lays out, as a procedure, the order in which to confirm the events of the accumulation schematic (PS, SC, AR, ST, spring, SOS), where the structure gets invalidated, and how volume should change character at each stage. At the same time, it doesn't hide the method's chronic trap — 'in hindsight, everything looks like Wyckoff.' It closes by connecting the one thing Wyckoff could only ever infer — what the big players are actually doing — to direct measurement with on-chain data.
- The Wyckoff method is an analytical framework that assumes the market is moved by a single hypothetical big player — the Composite Man — and tracks his footprints through the accumulation → markup → distribution → markdown cycle.
- The accumulation schematic is a map on which the events PS, SC, AR, ST, spring, and SOS must show up in a fixed order; the key to identification is not any single event but whether the sequence and the volume agree.
- A spring is a brief break below the range low that absorbs stop-loss and liquidation supply before snapping back inside — the hundred-year-old prototype of what modern SMC calls a liquidity sweep. A break of the spring low is the structure's invalidation point.
- Because the event definitions are subjective, the reproducibility critique — everything fits after the fact — remains valid. Cross-checking chart-based inference against independent evidence like on-chain capital flows is the approach that patches this limitation.
The Composite Man — imagine the market as a single big player
Richard D. Wyckoff (1873–1934) entered the market at 15 as a runner for a Wall Street brokerage, worked as a broker and market-publication publisher, observed the great traders of his era — Jesse Livermore among them — firsthand, and in 1931 distilled his conclusions into an educational course. The conclusion was singular: price moves because of big money's accumulation and disposal of supply, not because of the news. Unlike the other classics that had you memorize chart patterns, Wyckoff taught you to read the actor behind the pattern.
His tool for that is the Composite Man. The real market has countless participants, but for analysis, assume every rise and fall is the result of a campaign run by a single operator behind the curtain. This assumption isn't a claim of fact — it's a device for converting the question. The unanswerable 'why did price go up' becomes the testable 'is that one man accumulating right now, or handing off?' Who these big players are in today's market is covered in What Is a Whale.
① Supply and demand — price moves only on the difference between buying pressure and selling pressure. ② Cause and effect — the size of the sideways range (accumulation or distribution) is the cause that produces the size of the subsequent trend as its effect. The longer the range, the bigger the release. ③ Effort versus result — when price (the result) fails to keep up with volume (the effort), it's a suspicion signal that someone on the other side is absorbing or distributing supply. This third law is the working engine behind every event call below.
The accumulation schematic — a map of phases and events
The Wyckoff accumulation schematic is not a picture of 'this is the shape you'll see' — it's a map for checking whether the events show up in a fixed order. Phase A is the halt of the downtrend. PS (preliminary support) produces the first meaningful buying response, then at the SC (selling climax) panic selling pours out on a volume explosion and someone catches that supply. The AR (automatic rally) that follows immediately is the reaction showing selling pressure has momentarily drained. At this point, the SC low and the AR high are locked in as the lower and upper boundaries of the range against which every later judgment is made.
Phase B is the building of the cause. Price oscillates inside the range, repeatedly checking the low with STs (secondary tests) — and the identification point is whether volume dries up on each successive test. Phase C is the decisive moment, the spring (next section). Phase D is the stretch where the SOS (sign of strength) — a volume-backed breakout above the top of the range — and its pullback, the LPS (last point of support), hold above the former top. Only in Phase E does the trend (markup) actually unfold. Which price levels inside the range attracted the most executions can be cross-checked with the volume profile.
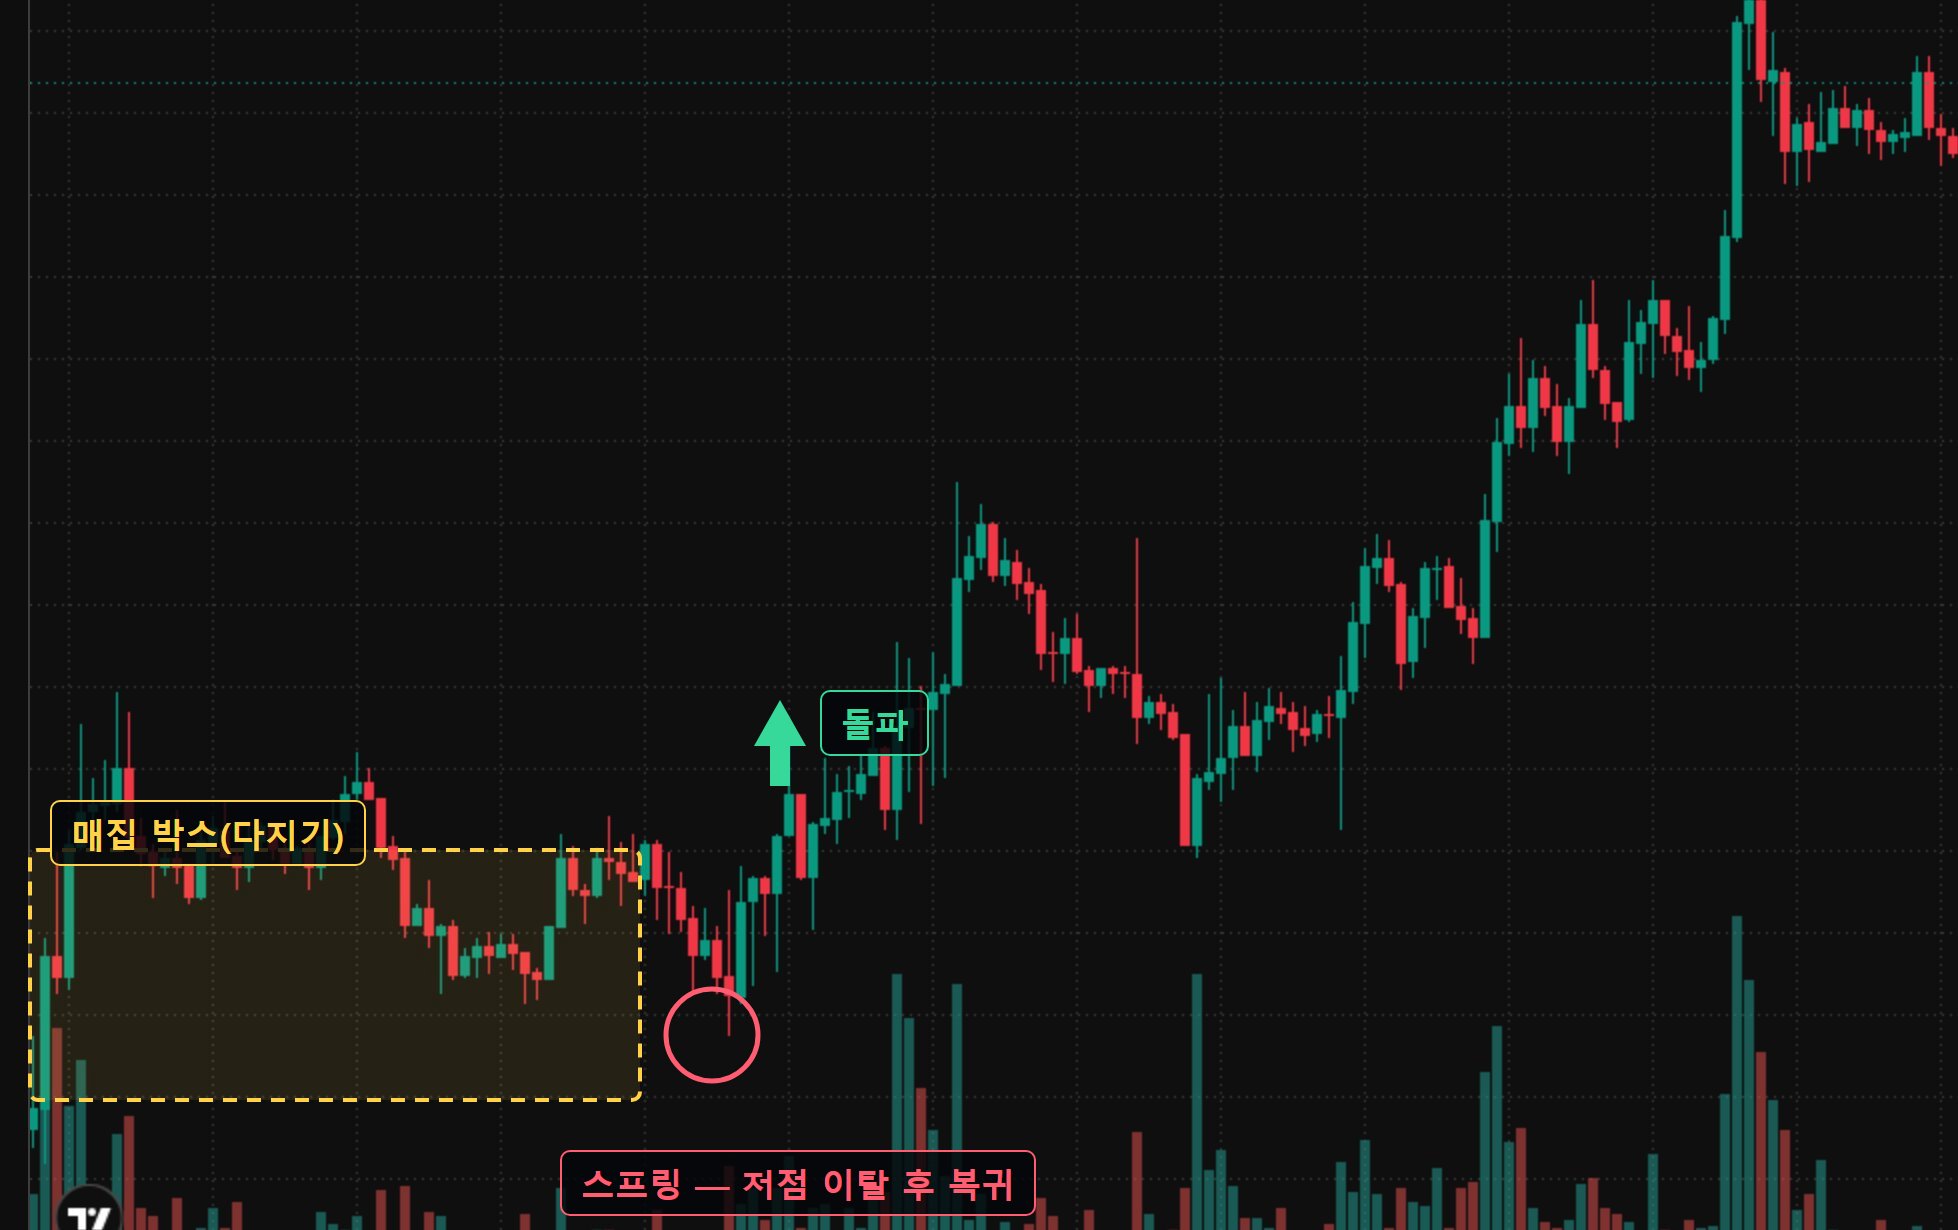
The rough benchmarks Wyckoff practitioners reference run like this. At the SC, volume explodes to 2–3x or more of the prior 20-bar average; by the late-Phase-B STs, even though the same price level is being tested, volume dries up to half or less of the SC's. That's circumstantial evidence the sellers are being exhausted. Conversely, if volume swells again on each test, supply is still alive and the accumulation hypothesis loses credibility. The trick is to read the relative change at the same location, not absolute numbers.
The spring — Wyckoff's liquidity hunt
The spring is a Phase C move that briefly breaks below the range low, manufactures the fear that 'support has broken,' fills the stop-loss selling and forced liquidation supply clustered beneath the low, then snaps quickly back inside the range. Wyckoff read it as the Composite Man's final shakeout — testing the remaining supply and absorbing the last of it cheaply. You've probably noticed: this is the same structure modern SMC calls a liquidity sweep — the terminology is just a hundred years younger, and the mechanism of harvesting the order cluster beyond the extreme is identical.
Take one educational calculation. Say a coin has been building a range for six weeks between a $100 low and a $112 high, then breaks below the low, prints $97 (-3%), and recovers back inside the range within two days. In Wyckoff's grammar, the structure's invalidation point is unambiguous — a break of the spring low at $97. If we assume traders watch the $101 area as a reference after the recovery is confirmed, the distance to invalidation is about $4 (roughly 4%), and with the target set at the range top of $112, the reward is $11. That's a risk-reward of roughly 1:2.7 — and the point of the calculation is that if this ratio doesn't hold, the setup flunks no matter how pretty the structure looks.
A textbook spring doesn't end in one act. The confirmation step is whether a low-volume re-decline (the Test) after the recovery stops above the spring low. If the test threatens the spring low again, or volume swells, absorption isn't finished. It isn't the single scene of 'break and recover' — the three-part chain of spring → test → SOS has to complete before Phases C and D are considered linked.
The identification procedure — confirm the events in order
The core discipline of Wyckoff identification is one rule: never skip events and jump to the conclusion. The procedure below is not a set of trade instructions — it's the order for verifying whether the range you're watching has earned the accumulation label.
- Confirm the preceding trend — was there a meaningful decline first? A range without a prior decline doesn't qualify as an accumulation candidate. The same range with a preceding advance calls for the distribution map instead.
- Confirm the Phase A events — was there an SC on a volume explosion, and its reaction, the AR? Without these two you can't even draw the range boundaries.
- Lock in the range boundaries — draw the SC low as the bottom and the AR high as the top. Every subsequent break/recovery call is judged against these two lines.
- Observe Phase B — do the STs respect the low, and does volume dry up on each test? Most of the real work here is waiting instead of concluding prematurely.
- Judge Phase C — when a break below the low appears, watch the recovery speed and the volume. A fast recovery within 1–3 bars is a spring candidate; a failed recovery is just a breakdown. Also confirm that a low-volume test stops above the spring low.
- Confirm Phase D — does a volume-backed SOS close its body through the top, and does the pullback (LPS) hold above the former top? Only here is the schematic complete.
- Write down the invalidation point — a break of the spring low ($97 in the example above), or a collapse back inside the range after the SOS. Commit in advance, in writing, that if this line breaks the accumulation hypothesis is discarded. A Wyckoff analysis without an invalidation isn't analysis — it's wishful thinking.
Most sideways action in the market is neither accumulation nor distribution — just directionless stagnation. Price can drift sideways indefinitely without an SC, without volume changing character, without a spring. The moment you drape an accumulation narrative over a range where the required events never showed up, the analysis turns into fiction, and the belief that 'smart money is still accumulating' becomes the sweetest excuse for delaying a stop-loss. The event checklist is the guardrail against that temptation.
Distribution — accumulation's mirror image
The distribution schematic is accumulation flipped upside down. At the end of a long advance comes the BC (buying climax) — euphoric buying pours in on a volume explosion while someone on the other side hands off supply. The reaction AR sets the range low, and STs knock on the top. The spring's mirror image is the UT/UTAD (Upthrust After Distribution): a brief poke above the top that looks like a breakout to new highs before falling back inside the range — a fake breakout, read as the point where supply is handed to the breakout chasers. The structure completes when the SOW (sign of weakness) — a volume-backed break below the low — appears, followed by the failed rally, the LPSY (last point of supply).
In numbers: if a breakout from a range topped at $200 spikes to $206 (+3%), prints the day's largest volume, and still surrenders the close back inside the range (below $200), the gap between effort (record volume) and result (a round-trip close) is extreme. That's the spot where the third law reads 'someone took the other side of all that buying' — and in this case, invalidation is a re-break above the UTAD high at $206. If the $190 low then gives way on volume (SOW) and the bounce dries up around $195 (LPSY), the distribution hypothesis has had every event show up in sequence.
Unlike the stock-era schematics, distribution in a 24-hour leveraged market has been observed to run in compressed form. UTADs repeat several times in a topping range, or a liquidation cascade punches through the low before the range even finishes drawing. The asymmetry — accumulation grinds for weeks while distribution wraps up in days — is common, so factor in that a topping range gives you far less time to make the call.
The limits — in hindsight, everything is Wyckoff
The Wyckoff method's biggest trap is hindsight confirmation. On a completed chart the spring and the SOS are crisp, but in real time a break below the low looks identical whether it's a spring or a genuine breakdown. Anyone can slap the accumulation label on a chart that ended in a rally and the distribution label on one that ended in a decline after the fact — which is why the jab 'in hindsight, everything is Wyckoff' lands. Because the event definitions are subjective, different analysts draw different schematics on the same chart, and as a result there is effectively no published independent backtest of the method's performance — a reproducibility problem that SMC, Wyckoff's heir, inherited intact.
① The single-operator assumption is a fiction — the real crypto market has market makers, VCs, foundations, and arbitrage bots tangled together for different purposes, with plenty of stretches that never converge on a single intent. ② Liquidation cascades are a force Wyckoff's era never had — a chain of forced leveraged liquidations can ignore and blow straight through a range structure in an instant, and that break is neither a spring nor an SOW but mechanical selling. ③ Phases mean nothing in front of a macro shock — rate and regulatory news shatter the structure whether it was accumulation or distribution. ④ On leverage, even 'waiting' has a cost — while Phase B drags on for weeks, a futures position stays exposed to funding rates and volatility the whole time.
The practically sound conclusion, then, is to treat Wyckoff as a hypothesis-generating tool, not a confirmed signal. When a range appears, form the hypothesis that 'this could be accumulation,' verify it against the event checklist, and discard it without sentiment at the invalidation point. And whenever possible, cross-check the hypothesis against independent evidence from outside the chart — the evidence Wyckoff himself could never have, and the subject of the next section.
Wyckoff's problem isn't that it's wrong — it's that it's only ever right in hindsight. The identification procedure and the invalidation criteria are the only tools that narrow that gap.
Whale Story measurement — the actual accumulation footprints of smart-money wallets

Wyckoff's fundamental constraint was data. He had nothing but indirect evidence — the trade tape and volume — from which to infer the Composite Man. The on-chain era is different. The wallets of market makers, VCs, and foundations sit on a public ledger, and exactly when they moved how much, and where, is recorded block by block. The Composite Man has gone from an assumption to an object of observation. The methodology for identifying and verifying those wallets is covered in On-chain Whale Tracking.
The logic of cross-confirmation is simple. When a range near the lows overlaps with net exchange outflows (coins leaving exchanges), it reads as on-chain corroboration of the accumulation hypothesis; when a range near the highs overlaps with net inflows, as corroboration of the distribution hypothesis — the precise limits of netflow interpretation are laid out in the On-chain Netflow document. When two independent pieces of evidence point the same way, the hypothesis gains credibility — but even when both line up it's no certainty, and no combination guarantees the future. Nor does it change the fact that in a leveraged market, even a correct hypothesis with the wrong timing is a loss.
① Mark the range boundaries and events (SC, AR, ST) on the chart and form an accumulation/distribution hypothesis → ② check in the smart-money wallet feed whether foundation, VC, or MM supply in that coin was moving into exchanges or out to cold wallets over the same period → ③ the moment a spring or UTAD candidate appears, cross-reference large fills and liquidation reactions in real time → ④ log hypothesis, evidence, and outcome to build your own verification dataset. Turning inference into measurement is the modern use of this hundred-year-old method.
Wyckoff's Composite Man was an assumption, but on Whale Story you can see that big player's footprints as measured data. The smart-money tracker monitors, in real time, the on-chain capital movements of wallets classified and verified as market makers, VCs, or foundations, showing whether foundation and VC supply is leaving exchanges during a range near the lows (accumulation-side circumstantial evidence) or flowing into exchanges during a range near the highs (distribution-side circumstantial evidence). The large-fill and liquidation feeds on the live tracker become the tool for checking, the moment a spring or UTAD candidate appears, whether stops and liquidations are actually chain-filling, and suspected-top signals detect the signs of the exhaustion-style spikes that often coincide with distribution phases. In past observations, there have been cases where stretches of dull range-bound drift overlapping with net exchange outflows preceded a subsequent expansion in volatility — but this is merely a tendency in past data, not a prediction of any specific move or a recommendation to trade.
FAQ
Does the Wyckoff method apply to the crypto market too?
Wyckoff practitioners hold that the principles are the same in any liquid market where supply and demand operate. That said, the original was written for the stock market of 100 years ago, and 24-hour trading, liquidation cascades, and thin altcoin liquidity are variables that didn't exist back then. Liquidation chains in particular can ignore and punch straight through a range structure, so it's safer to treat the method as a hypothesis-generating tool rather than a confirmed signal.
How do you tell a spring apart from a genuine breakdown?
In real time they look identical — that is the inherent limit of this pattern. Practitioners look at the speed of the recovery back inside the range (typically 1–3 bars), the divergence between volume and price reaction at the moment of the break, and whether the low-volume test after the recovery stops above the spring low. A break that fails to recover is not a spring but a breakdown, and white-knuckling in anticipation of a spring with no invalidation criteria is the most dangerous response of all.
How do Wyckoff and SMC differ?
The skeleton is the same. SMC's liquidity sweep is close to a modern-language translation of the spring and UTAD, and the assumption that big money fills its orders where the opposing orders cluster is a descendant of the Composite Man. Wyckoff puts more emphasis on the time structure of phases and event sequence, while SMC further developed price-zone designation rules like order blocks and FVGs. They share the same weakness: subjective rule definitions that make reproducibility hard to verify.
Once an accumulation schematic completes, is it okay to buy?
This piece can't make that call for you. Even with every event on record, the structure is only an interpretation of the past — it guarantees nothing about the future, and real-time calls are often wrong. This document is for educational and informational purposes and does not recommend any specific entry. Whether and how much to respond is a domain decided within your own invalidation criteria and position-sizing rules, at your own responsibility.
Can the chart alone tell you whether it's accumulation or distribution right now?
From the chart alone it's an estimate, nothing more. The same range reads in opposite directions depending on the preceding trend, and the answer often only reveals itself in hindsight. That's why the approach of cross-checking against independent on-chain evidence — exchange netflows, or the actual capital movements of smart-money wallets — gets used. Even when both pieces of evidence point the same way, nothing changes the fact that it's not confirmation, only added credibility.