The Whale Playbook — How to Read Whale Data
Published 2026.07.01 · Updated 2026.07.06
"Why not just find a whale wallet and buy whatever it buys?" — nearly everyone who has searched for Hyperliquid whales has entertained the thought at least once. The short answer: copying the direction of top wallets is structurally disadvantaged by three layers of gap — lag, size, and purpose. That doesn't make whale data useless. Instead of a position's 'direction', read the 'levels' formed by liquidation prices and average entries, the long/short 'crowding', and how those 'change' — and the liquidity map you used to sketch by guesswork becomes one drawn from live measurements. This piece walks through the common patterns of surviving whales confirmed by direct observation, the structure that makes copy-buying fail, and the correct procedure for reading whale data, in that order.
- On Hyperliquid, positions, average entries, liquidation prices, and margin are all public on-chain, so the behavior of top wallets can be observed directly. What the data doesn't capture: intent, total portfolio, and time horizon.
- What was repeatedly observed in long-surviving wallets wasn't predictive skill but defensive habits — low effective leverage, scaling in and out, and cutting exposure when a position moved against them.
- Copy-buying turns the same direction into a different game because of three layers of gap: lag (a worse entry price), size (a different liquidation distance), and purpose (the position may be a hedge or a carry).
- The practical use of whale data isn't copying direction — it's using liquidation-price and entry-price levels as a map, and reading long/short crowding and its changes as supporting evidence for your own scenario.
What Whale Data Can Tell You — and What It Can't
Hyperliquid is a perpetual futures DEX (perp DEX) where every order, position, and margin change is recorded on-chain. With nothing but a wallet address, you can view that account's position direction and size, average entry, liquidation price, leverage, unrealized PnL — and how all of it has evolved over time — in real time. The 'big player's book' that could only be guessed at on centralized exchanges is public data here. That's why whale tracking as a genre formed around Hyperliquid.
But three things never show up in the data. First, intent — the book alone can't tell you whether a position is a directional bet, a hedge for spot held elsewhere, or a carry harvesting funding. Second, the total portfolio — the wallet on your screen may be only a slice of that person's assets, and offsetting positions on other exchanges or in spot wallets are invisible. Third, time horizon — the data won't tell you whether it's a trade measured in hours or an accumulation measured in months. Reading whale data starts with acknowledging these three blind spots.
Visible: direction, size, average entry, liquidation price, leverage, and the history of margin changes. Invisible: intent, total portfolio, time horizon. If the large short on your screen is actually a hedge against spot holdings, its owner doesn't lose when price rises. The equation 'whale went short = betting on a drop' is an interpretation the data does not support.
The Common Patterns of Surviving Whales — Direct Observation
When Whale Story grouped the top balance-ranked wallets into an anonymous cohort and watched them, what kept showing up in long-surviving accounts wasn't spectacular calls but defensive habits. First, low effective leverage — instead of maxing out margin at the highest multiplier, they kept notional exposure low relative to the account, and were often observed with liquidation prices sitting tens of percent away from the current price. Second, scaling — both entries and exits were split across multiple clips, so the average entry formed a zone rather than a single point. Third, when a position moved against them, the recurring pattern was to cut exposure first and rebuild the cushion rather than average down.
By contrast, the final books of wallets that rocketed up the rankings and then vanished shared high multipliers and thin margin. In short, the variable separating the top cohort was less 'where they bought' and more 'how much they were engineered to lose when wrong'. That is the observed-in-the-wild version of the 1R control covered in the risk management chapter. One caveat up front: this observation carries survivorship bias, which we address later.
What makes a whale a whale isn't predictive power — it's a structure that survives being wrong.
Why You Shouldn't Copy-Buy — The Triple Gap of Lag, Size, and Purpose
The first gap is lag. Observation always comes after the fill. If you discover a whale holding BTC from a $100,000 average entry when price is already $103,000, your copy entry starts 3% behind. When the whale exits at $105,000, the whale books +5% while the copier gets +1.9% — and when a pullback comes, what is comfortable room above the entry for the whale is immediately a losing zone for the copier. More lethal than entry lag is exit lag — whales unwind quietly in pieces, and the observer finds out late.
The second is size. A liquidation price sits roughly the reciprocal of the multiplier (1/N) away from the entry. A whale running a $100,000 long at 3x has a liquidation price near $67,000 — a structure that withstands a 33% drop. Copy the same direction at 20x and your liquidation price sits near $95,000 — a 5% distance. In that case, an ordinary wick down to $94,000 and back sends only the copier out through liquidation, while the whale sits through the same spot untouched. Same direction, different survival conditions — it is not the same trade.
The third is purpose. As we saw earlier, a large short may be a hedge, and a wallet holding both longs and shorts may be running a funding-rate carry or market making. Different purposes mean different payoff structures and different thresholds for holding on, and what is rational persistence for that wallet becomes irrational bag-holding for the copier. Lag, size, purpose — these three gaps aren't closed by effort; they're structural, built into the very position of being an observer.
Copy-buying is a game of 'entering late, never seeing the exit, and holding with weaker hands'. High-multiplier copying in particular gets the copier liquidated by interim swings even in stretches where the whale ultimately turned out right. The heart of this gap: a leveraged position can die on the path even when the direction was correct.
The Right Way to Use It — Read Levels and Crowding, Not Positions
The practical value of whale data lies in three readings, not direction copying. First, levels — price zones where top wallets' liquidation prices and average entries overlap are places where forced orders and defensive size actually exist, turning an estimated heatmap into a measured liquidity map (compare with the liquidation heatmap chapter). Second, crowding — the more the top wallets' long/short distribution tilts one way, the more fuel accumulates for a sharp move in the opposite direction. Third, change — events like margin top-ups, exposure cuts, and fresh entries say more than any snapshot.
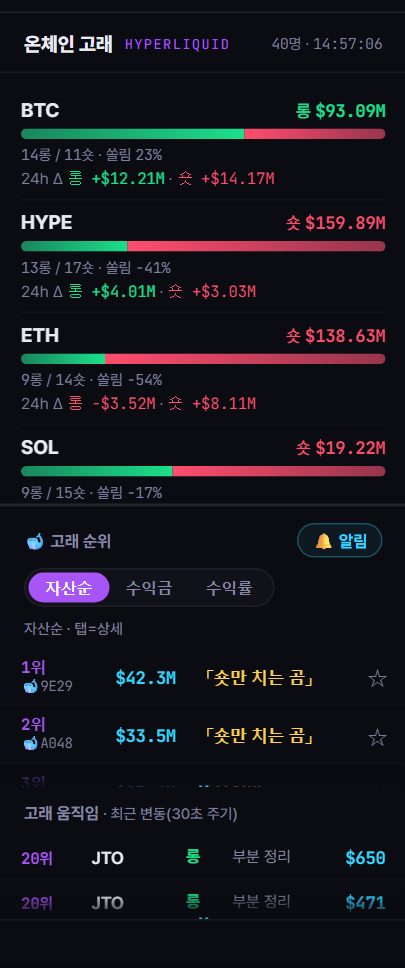
- Check the crowding — Look at the top wallets' long/short distribution. If it's tilted to one extreme, classify the phase as one where squeeze risk in the opposite direction is building rather than fresh fuel in the crowded direction. For cross-checking against funding and open interest, follow the procedure in the funding & OI chapter.
- Mark the levels — Transfer the price zones where liquidation prices cluster and where average entries cluster onto your chart. Liquidation clusters are candidates for zones that pull price in and amplify the move once touched; entry-price clusters are candidates for measured supply/support zones where defensive size may show up.
- Track the change — As price approaches a cluster, watch whether those wallets are adding margin (the will to hold) or cutting exposure (a retreat). The same level means different things depending on which way the change points.
- Feed it into your own scenario — Whale levels are not entry signals; they're raw material for setting your scenario's invalidation point and target candidates. The subject of every decision is always your own plan.
- Record — Log what actually happened at the clusters, and verify for yourself whether this data holds up on your timeframe and in your style.
Say top-whale liquidation prices cluster between $97,900 and $98,300. A trader building a scenario around support holding above that cluster would place invalidation below it, where the cluster has been consumed — say, a break of $97,500. From an observation point of $99,000, that's a 1.5% stop distance; taking the prior high of $103,500 as a target candidate gives 4.5% — a structure of roughly 1:3 risk-reward. The point is not an invitation to enter — it's that measured levels let you anchor 'where you'll admit you're wrong' in structure instead of an arbitrary percentage.
Whales Get Liquidated Too — The Failures the Data Shows
Before treating whale data like an oracle, remember this: whales get liquidated, repeatedly. The public ledger still holds the cases — famous wallets that insisted on double-digit multipliers with their liquidation prices in plain view and burned through their balance in cascading liquidations over a few weeks, and positions worth hundreds of millions of dollars in notional force-closed by a single move. Big capital doesn't mean more information, and it doesn't mean being right. If anything, a large position with a public liquidation price becomes a target in its own right — dense liquidation levels read as a hunting map too.
The observation methodology has honest limits of its own. First, survivorship bias — the 'common patterns of surviving whales' are drawn only from the sample that survived; wallets with the same habits that vanished never make it into the statistics. Second, sample and period dependence — there is no guarantee that a bull-market cohort's habits hold up in a bear market. Third, identification limits — if one person runs multiple wallets, or several parties share one, the very unit of 'one whale's behavior' starts to wobble. Whale data is measured; its interpretation is still inference.
Whale levels and crowding don't tell you future direction. There's no guarantee that extreme crowding resolves into an immediate reversal, and no guarantee that price ever reaches a liquidation cluster. Whale data doesn't make losses disappear — it just replaces one unfounded guess with one measured observation.
Measured on Whale Story — Putting Liquidation and Entry Levels to Work
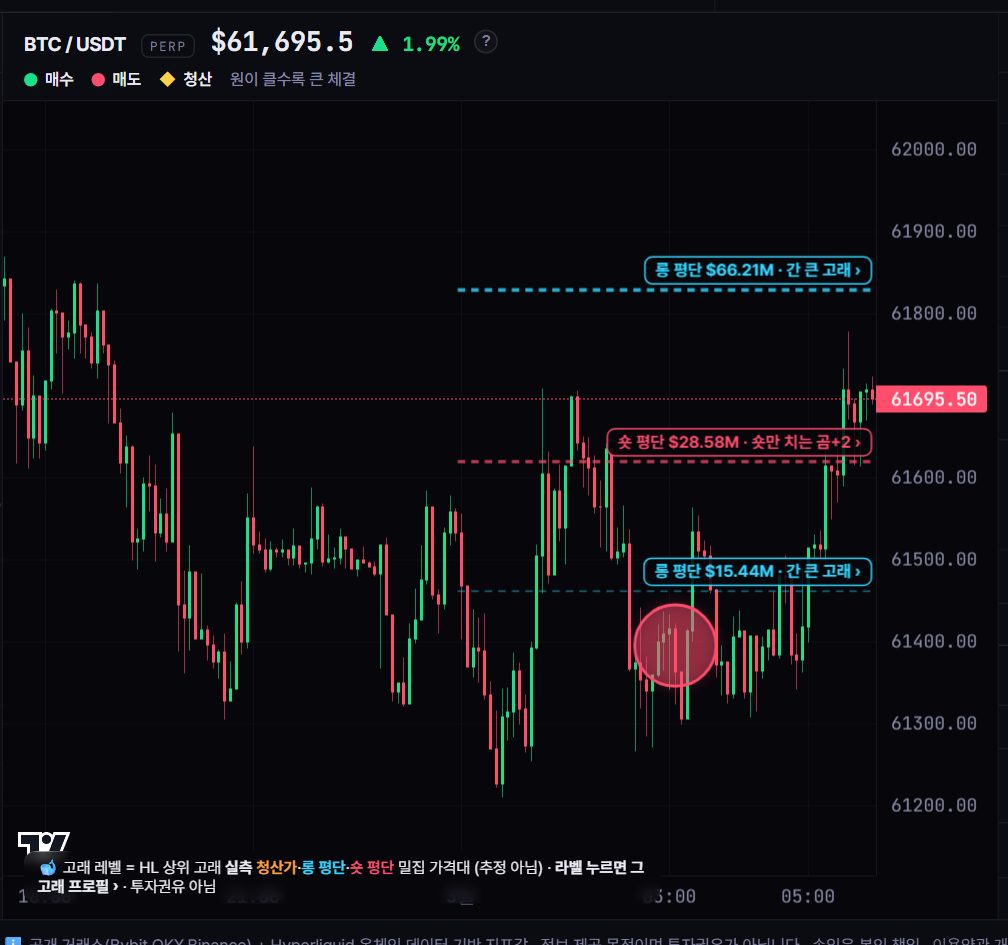
The reading procedure above can be run exactly as written on the Whale Story live tracker. Whale Levels overlays the actual average entries and liquidation prices of top Hyperliquid whales on the chart to show where they cluster, and the ranking board tracks top wallets' long/short distribution and how it shifts. The way to use the tool: as price approaches a cluster, check on one screen whether liquidations actually start firing in a chain and whether the wallets are reinforcing their margin.
Derivatives positions are only half of whale behavior. The other half — reading on-chain money flows like wallet-to-wallet transfers and exchange deposits and withdrawals — is covered in the next chapter, on-chain whale tracking. And whatever the reading, the final step that connects it to your account is always position sizing — however precise the whale data, without 1R control a single exception ends the account.
Everything in this piece can be verified against live measurements. Whale Story's live tracker aggregates top Hyperliquid whales' positions, average entries, and liquidation prices around the clock and overlays them on the chart, while the ranking board tracks long/short crowding and margin changes. In past observations, as price approached liquidation clusters, forced fills repeatedly piled into the liquidation feed and the move amplified. For reading crowding during sharp run-ups, the suspected-top signals serve as a cross-check, and the smart-money tracker lets you compare verified smart-money wallets' on-chain moves against derivatives position data on one screen. All of it is past and present observational data — no arrival at any cluster and no reversal of direction is guaranteed.
FAQ
Can't I just copy a whale wallet's positions outright?
We don't recommend it. Observation comes after the fill, so your entry price starts out worse; you learn about the whale's exit late; and even in the same direction, a different multiplier means a different liquidation distance — interim swings can force the copier out first, alone. Add the possibility that the position is a hedge or a carry, and copying direction means playing a structurally different game.
Is a large whale short a bearish signal?
It can't be assumed. A large short may be a hedge for spot holdings or positions on other exchanges, or a position built to collect funding. The on-chain book records only direction and size, never intent, so reading the whole top cohort's crowding and its changes produces fewer interpretation errors than reading a single wallet's direction.
How often are whales right?
That can neither be measured nor quoted. Per-wallet hit rates are unreliable because of sample, period, and identification problems, and the public ledger also holds records of whales collapsing through repeated liquidations. What direct observation confirms is not a hit rate but a tendency: the longer a wallet survives, the more it shows the defensive habits of low effective leverage and scaling.
Where can I see whale liquidation prices and entry levels?
In Whale Levels on the Whale Story live tracker, you can see the price zones where top whales' actual average entries and liquidation prices cluster, and on the ranking board, how long/short crowding shifts. Note that these are detection and observation tools — no display is a trade recommendation. Investment decisions and their outcomes are entirely your own responsibility.