Candles and Volume — The First Grammar of Chart Reading
Published 2026.07.06
Search for how to read candlestick charts and you'll be buried in dozens of pattern names — hammers, engulfings, dojis. But the difference between someone who memorized names and someone who actually reads charts isn't the size of their vocabulary. A candle is a record of the orders that got filled during a fixed window of time, and volume is the number that tells you how much money actually participated in that record. This guide starts by dissecting the anatomy of a single candle, then walks through the exact order in which to apply the filter "never trust a candle without volume." If you came expecting a pattern encyclopedia, let's clear that fantasy first — what you need isn't names, it's a reading sequence.
- A candle is a record, not a pattern. The body is the distance between open and close; the wicks are the footprints of prices that were visited and rejected during that window.
- Two identically shaped candles can mean completely different things depending on where they appear (near support or resistance?) and their volume (how many multiples of average?).
- Refusing to count breakout or reversal candles that lack volume as signals is the first filter every beginner should internalize.
- Candles and volume are lagging records of trades already completed — they guarantee nothing about the future. The single biggest trap is the habit of calling direction off one candle.
Anatomy of a Single Candle — What Open, Close, and Wicks Record
One candle is a summary of every trade executed during your chosen timeframe. On an hourly candle, the first fill of that hour is the Open, the last fill is the Close, the highest price traded in between is the High, and the lowest is the Low. If the close is above the open the candle prints green; below, it prints red. The span between open and close is the body, and the excursions beyond it are the wicks. Every charting technique — moving averages, support and resistance, all of it — is built on top of these four numbers (OHLC).
Let's reconstruct one with numbers. Say a BTC hourly candle opens at $100,000, prints a high of $101,800 and a low of $99,600, and closes at $101,500. The body is +1.5% (100,000 → 101,500). Price traveled up to 101,800 before getting pushed back, leaving a 0.3% upper wick, and got pressed down to 99,600 before recovering, leaving a 0.4% lower wick. Over that hour, price swung across a 2.2% range, but the final record reads: 'dipped low, climbed back, and closed holding the upper part of the range.' Reading a candle means reconstructing that hour's battle from these four numbers — not slapping a name on a shape.
One hourly candle compresses four 15-minute candles, or sixty 1-minute candles. What looks like violent chop on a lower timeframe gets summarized as a single wick on a higher one. That's why 'which timeframe to watch' is itself a decision — and once you've picked one, the rule is to stay on it until your read is complete. How to make that choice is covered in the timeframes guide.
The Tug-of-War Between Body and Wick — What Candles Say About Buyer vs. Seller Control
A candle with a long body and short wicks records a window where one side steamrolled the other. A candle with a short body and long wicks records prices that were visited and rejected. A long lower wick reads as 'sellers pushed price down there, but someone absorbed it and drove it back up'; a long upper wick reads as 'buyers pushed price up there, but supply poured in from above.' Where the close lands within the range tells you who won that round.
Pattern names are just nicknames for this kind of reading. A Hammer is 'a long lower wick at the end of a decline'; an Engulfing is 'a body that swallows the previous body in the opposite direction.' Rather than memorizing dozens of names, it's better to ask the same two questions of every candle — which price got rejected, and what level did the close defend? If you can answer those, you can read candles you don't know the names of. If you can't, knowing the names won't help.
And location creates meaning. The same long lower wick, printed near a support level that has produced multiple bounces before, becomes an observation that 'someone is defending that price zone' — printed in the middle of nowhere with no reference level, it's closer to noise. Candles aren't read in isolation; they're read on top of levels. How to define those levels is the subject of the next guide, support and resistance.
A candle doesn't tell you direction. It only tells you one fact: 'this price was rejected.'
Volume — The Axis That Determines a Candle's Credibility
Volume is the quantity actually traded while a candle is forming. A candle's shape can be manufactured with relatively little money when the order book is thin, but volume shows how much size actually changed hands in that move. That's why traders treat the candle's shape as the 'claim' and volume as the 'evidence.' A candle with a plausible claim and no evidence — that's the candle to filter out.
The benchmark isn't an absolute number but the multiple versus average. If the average volume of the previous 20 candles is 1,000 BTC and a candle breaking through resistance prints 3,200 BTC (3.2x average), that's a directional decision with broad participation. The same breakout shape on just 700 BTC (0.7x) is an excursion without participation. In past observations, breakouts lacking volume have frequently round-tripped back to where they started, leaving nothing but a wick — which is why 'never trust a candle without volume' has become the standard first filter.
- Pick one timeframe and lock it in — switching candles mid-read changes your conclusion.
- Look at where the candle printed first — near support or resistance, mid-trend, or in a vacuum with no reference level.
- Read the body — which direction did the close move relative to the open, and where in the range did it finish.
- Read the wicks — which extreme was rejected, and does that rejection line up with the level.
- Compare volume against the average of the previous 20 candles — 2x or more counts as meaningful participation; below average doesn't count as a signal.
- Wait for confirmation from the next one or two candles — never conclude off a single candle.
Reading a Real Chart — How to View Price and Executed Volume Together
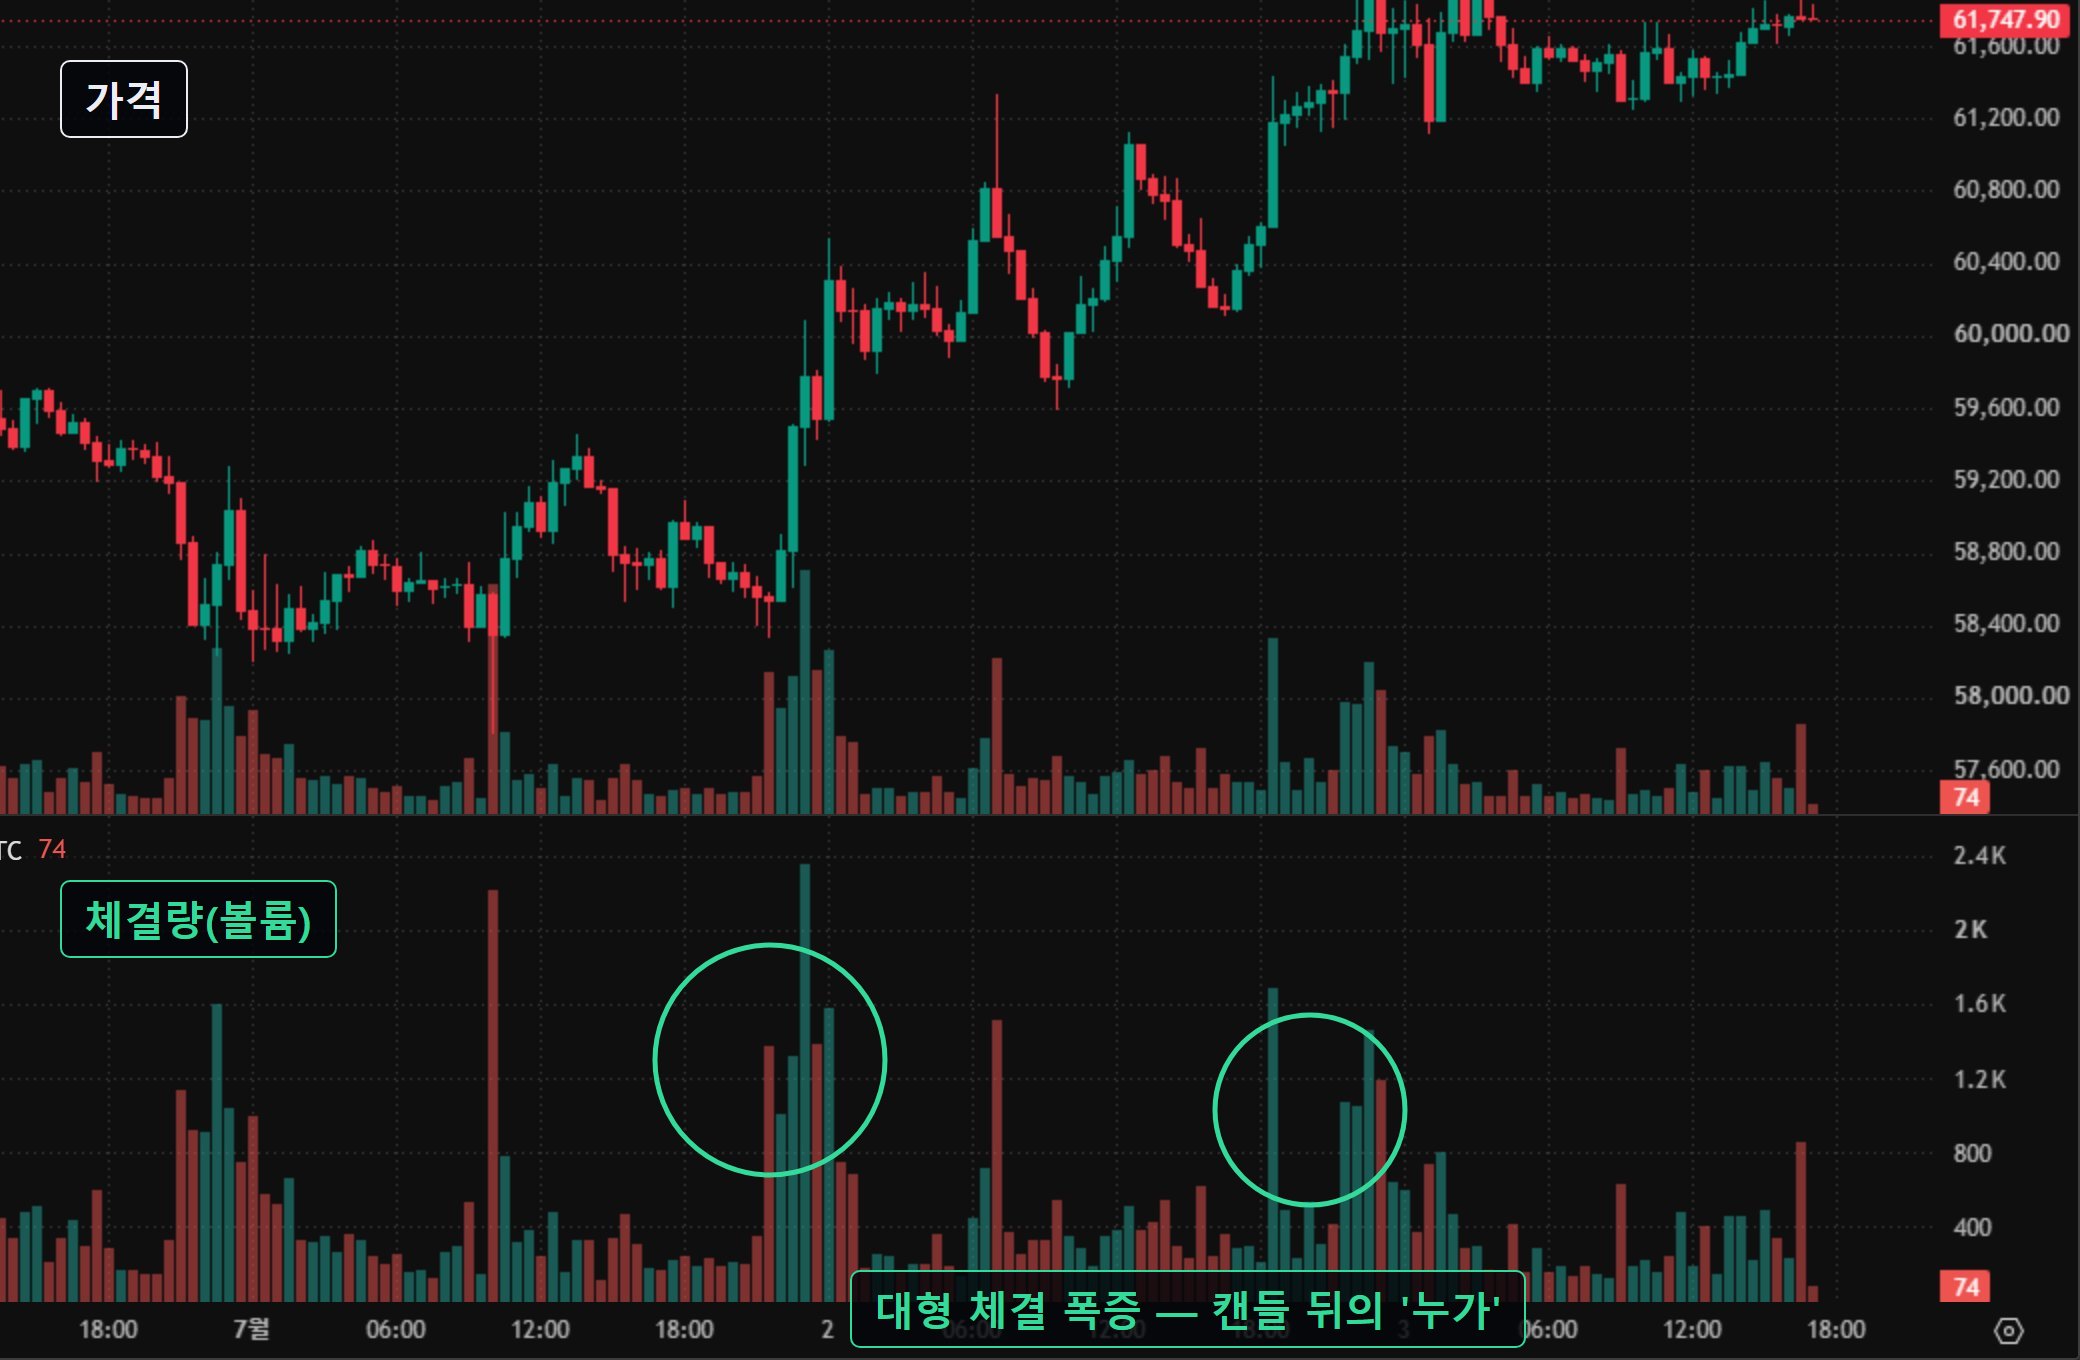
The chart above annotates a BTC 30-minute chart with volume and the zones where large executions clustered. Two things deserve attention. On the candles that decide direction, the volume bars tower well above average — and on the pullback candles that follow, volume visibly dries up. This combination — 'volume shows up on the move, dries up on the rest' — is a structure repeatedly observed while a trend is in progress, and it's the first rhythm a beginner's eye should learn to recognize.
The opposite combination is information too. When price keeps printing new highs while volume steadily shrinks, that's a record of participation cooling off; when volume expands on every down candle, that's a record of sellers running the table. The tool that goes one level deeper — splitting those executions into aggressive buys versus aggressive sells — is order flow and CVD, which belongs to the advanced track. At the beginner level, consistently layering three things — candle shape, location, and volume — is more than enough.
Beginner Traps — Pattern Memorization and Low-Volume Signals
The first trap is the pattern encyclopedia. Dozens of pattern names are ultimately nicknames for combinations of four variables: body direction, wick position, location, and volume. Knowing a name is not the same as reading the supply and demand at that spot, and if all you've done is memorize names, you're primed for confirmation bias — patterns that only appear on charts after the fact. On a hindsight chart, every reversal has a perfect candle sitting at it; in real time, all you have is an unclosed candle that keeps changing shape.
① Long wicks during dead hours — when the order book is thin, even small orders swing price hard and paint wicks. Don't over-read them. ② Huge candles on small-cap altcoins — they can be manufactured with relatively little capital, so shape alone can't confirm big-player inflow. ③ Candles that haven't closed yet — the shape keeps changing until the close, so a judgment made mid-candle often faces a completely different candle after the close. ④ Volume differences across exchanges — the same coin trades different volume on different venues, so pick one reference exchange and compare consistently.
Finally, let's be clear about the limits of the tool itself. Candles and volume are records of trades already completed — lagging data. The same shape-and-volume combination leads to a reversal on some days and a continuation on others, and no rule exists that separates the two in advance. Candle reading is one piece of evidence among several; it guarantees nothing about the future. In leveraged futures especially, sizing up a position on the strength of one candle means that even a correct read can get hit by liquidation on the shakeout before price gets there — which is exactly why the later guides in the beginner curriculum are all about that risk.
Verify It Live on Whale Story
If candles and volume are the 'summary' of executions, actual executions sit behind that summary. The large-trade tape on Whale Story's live tracker streams the big orders building the current candle right now — single executions in the hundreds of thousands of dollars and up. Where a volume bar is one lump-sum number, the tape unpacks that lump into individual fills, measured live.
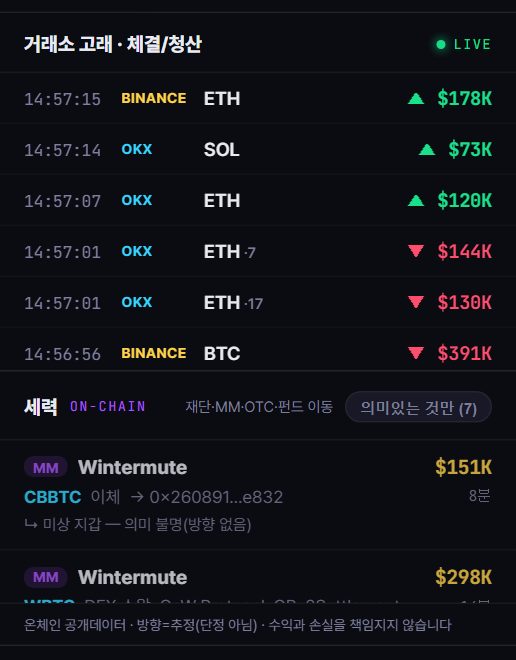
Watch the tape while a huge candle is forming and you can tell whether it was built by a handful of large orders or by the sum of countless small fills — a distinction that candles and volume bars alone cannot make. Candles moved by whale-sized capital and candles built by retail chasing have been observed to play out differently afterward, even when the shapes look identical. The fastest way to train your reading is to keep the chart and the tape side by side and cross-check them.
What this guide covered is 'how to read a single candle.' The next step is deciding where that candle printed — the methodology of drawing support and resistance — and after that, the timeframe combinations that decide which candles to watch. Candle reading only becomes raw material for decisions once it's combined with those two.
Candles and volume are the 'summary' of executions, and Whale Story shows the actual executions behind that summary, measured live. On the large-trade tape of the live tracker, you can see whether orders in the hundreds of thousands of dollars actually piled in while a huge candle was forming, or whether it was the sum of small fills. When surge candles print back to back, suspected-top signals logs observed cases of exhaustion-style rallies where price rises while participation quality deteriorates, and the smart-money tracker lets you cross-check whether verified smart-money wallets moved on-chain around a given coin's huge candles. All of this, however, is a record of past executions and transfers — it guarantees nothing about the direction of the next candle.
FAQ
Which timeframe should I use for candlestick charts?
There's no single right answer — it depends on your trading style. That said, while you're learning, it's better to start from higher timeframes like the 4-hour or daily. Higher-timeframe candles carry less noise and pack more information per candle, which makes them better practice material. How to combine timeframes is covered in detail in the timeframes guide.
Why does price drop right after a green candle prints?
Because a candle is a record of trades already completed, not a promise about the next direction. Green candles on below-average volume, in particular, are records of a rally without participation, and they frequently get retraced. If you made the call off a single candle without checking location, volume, and follow-through, the reading sequence itself is what needs fixing.
Where do I check volume?
The bar chart at the bottom of your exchange's chart or TradingView is volume. The same coin trades different volume on each exchange, and spot and futures volume are separate, so it's important to pick one reference exchange and market and compare consistently. Read it as a multiple of the recent candles' average, not as an absolute number.
How many candlestick patterns do I need to memorize?
Memorization itself isn't required. Every pattern is a combination of four variables — body direction, wick position, location, and volume — so if you can read 'which price got rejected and what level the close defended,' you can read candles without knowing their names. Names matter about as much as being able to talk with other traders; reading comes first, terminology later.