
Oliver Kell
Winner of the 2020 U.S. Investing Championship (sub-$1M division) — a rule-based trader who put his six-stage 'Cycle of Price Action' and his stop-first discipline out in the open
Published 2026.07.01 · Updated 2026.07.07
"Is the 941% for real?" — that's the first question most people who search this case have. The short answer: per public reporting, yes. Oliver Kell was reported to have won the stock division (sub-$1M accounts) of the 2020 U.S. Investing Championship with a return of roughly 941.10%. But that figure stands on three layers of conditions — a specific year, a specific regime, a specific individual — and the heart of the method Kell himself made public isn't the return; it's two procedures: "judge the stage, then set the stop first." This piece first strips away the conditions behind the number, then dismantles structurally why the method he disclosed worked and where it can break down.
- Won the stock division (sub-$1M accounts) of the 2020 U.S. Investing Championship with a publicly recorded ~941.10% — a past, publicly reported record of a specific individual, not a general result
- The skeleton of the method is the 'Cycle of Price Action' — first judge which stage of an advance a stock is in, and use the 10/21 EMA as the reference line for trend and pullbacks
- The real weapon isn't the entry rule but the invalidation design. Nail down the stop before entering, and when it breaks, get out without adding a reason
- Kell made no money for his first several years, and the 941% is what happened when the method met the 2020 growth-stock bull regime — learn the method, but the moment you make the number your goal, the structure collapses
Under What Conditions Did the 941% Number Come About
A big number becomes a misunderstanding the moment you erase its context. To turn Kell's 941% into something useful, you first have to state the conditions of the record precisely. Which contest, which account, which year?
Oliver Kell was reported to have won the sub-$1M stock division of the 2020 U.S. Investing Championship with a publicly recorded annual return of roughly 941.10%. It's a real-account contest record, but it's a past, single-year, single-individual performance — not a general result reproducible for just anyone.
The conditions come in three layers. First, it's a stock account — the loss structure is fundamentally different from crypto derivatives, where liquidation exists. Second, it's 2020 — a post-pandemic period when growth names like TSLA and Livongo were ripping, a regime extremely favorable to trend following. Third, it's the stage of a one-year return contest — the scores of other people, or the same method in other years, have nothing to do with this figure. It's more accurate to read the 941% not as proof that the method is superior, but as the record of a moment when the method and the regime lined up.
Weapon 1 — The Cycle of Price Action: Judge the Stage Before You Trade
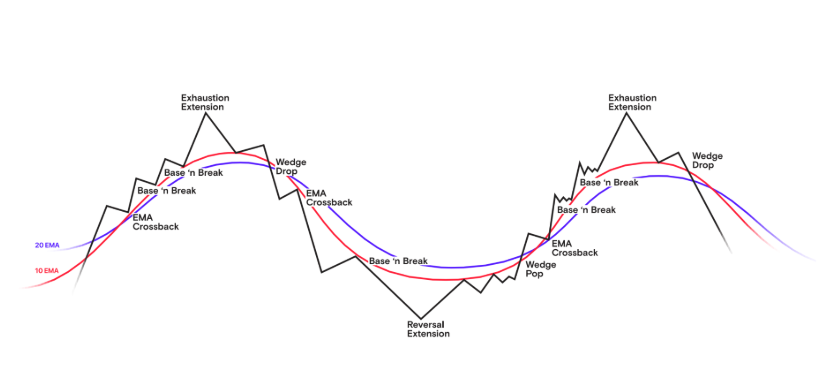
Kell's roots are in William O'Neil's CAN SLIM, and in his book "Victory in Stock Trading" he organized his own approach into the 'Cycle of Price Action' and put it out in the open. He divides a stock's advance into six stages — reversal extension → wedge pop → EMA crossback → base and break → exhaustion extension → wedge drop — and the structure is that you first judge which stage you're in, then take only the actions permitted at that stage. The very ordering — that stage judgment comes before the trading decision — is the identity of this method.
- Confirm the overall market is in an uptrend first — the regime comes before any single stock
- Judge where in the six stages of the cycle the stock sits — if the stage is ambiguous, hold off on judgment
- Use the 10-day and 21-day exponential moving averages (EMAs) as reference lines for whether the trend is holding and for reading pullbacks
- Set the invalidation point (the stop) before you enter
- When the reference line or the invalidation point breaks, drop your opinion and re-judge the stage
How to recognize each of the six stages on a chart is covered with diagrams in the complete breakdown of the Cycle of Price Action. The one point to hold onto here: the EMA isn't a "buy/sell" signal — it's a ruler for measuring whether the trend is still alive, and what a ruler does is judge state, not issue action. The general logic of folding reference lines into entry and exit decisions is in the entry and exit guide.
Weapon 2 — The Invalidation Point You Set Before the Entry
The line that recurs most often across Kell's interviews and book isn't a flashy entry formula — it's the stop principle. Not how much you'll make, but where you'll admit you're wrong and get out, nailed down before you enter. Once the stop is fixed, the position size is back-calculated from it, and once the position size is fixed, the damage a single failure inflicts on the account becomes a constant.
Before you enter, set the stop first. If that level breaks, you're out — no reasons attached. (A summary of the risk principle Kell made public.)
What this procedure builds is a risk-reward structure. If losses are cut mechanically at the invalidation point and profits are left to run as long as the trend is alive, then more than whether any individual trade hits, it's the ratio of the average loss size to the average win size that decides performance. This arithmetic is handled with numbers in the risk-reward and risk management guides, and the framework for hardening invalidation criteria at the setup level is the same grammar as designing day-trading setups.
Trend following shines only when there's a trend. In a market that flips direction often, the same rule gnaws at the account through consecutive stop-outs — this isn't an execution mistake but a cost built into trend following as a method itself. More dangerous is the moment after a string of stop-outs when you break the rule and delay your stop, and how that single instance ends an account is covered structurally in why you get liquidated.
Before the Champion — What the Years of Making Nothing Built
Look only at 941% and it seems like a genius's one big shot, but Kell himself has said he made no money for several early years of trading. What was built in that period wasn't profit — it was rules, and the habit of recording when he broke them. The 2020 number is the result of a favorable regime landing on top of that accumulation, not the output of some secret discovered one day.
A single year's return is half made by the regime. What's controllable is only process metrics — did you set the stop, did you honor it, how many trades broke a rule — and the trader who records these survives even when the regime turns. The psychological structure of rules collapsing during losing streaks is covered in the trading psychology guide.
There's no reason to idolize Kell's case, and none to belittle it. Its backbone is an utterly ordinary structure: someone who endured long enough and kept his rules met a favorable regime, and a big number came out. Flip it around and it also means the scorecard of someone carrying the same method into an unfavorable regime comes out completely different.
When You Move It to Crypto — What Carries, What Landmines Change, and the Limits
The procedure — stage judgment → reference line → invalidation first — doesn't care about the asset. But transplant it into the crypto derivatives market and the locations of the landmines change. It's a 24-hour market, so the node of 'judging by the close' blurs, and above all, leverage erases the room between the stop and liquidation.
In stocks a stop rule is 'something you just have to honor,' but in crypto derivatives, depending on the leverage multiple, a layout where the liquidation price arrives before the planned stop price can hold. In that case the rule never even gets the chance to execute. Before transplanting Kell-style discipline, the right order is to first check the arithmetic of leverage and liquidation.
Finally, let's write down the limits honestly. A contest win is a verified real-account record, but what's verified is that one year — a separate matter from long-term performance afterward or reproducibility in other markets. The six stages, too, are sharp on hindsight charts but subject to judgment in real time, sharing a weakness common to the trend-following family. So for the reader who wants to use this method in crypto, the realistic next step isn't imitating the number but observing — you can verify by actual measurement which stage of a trend large money actually moves at, on the whale playbook and the Whale Story live tracker.
What to take from Oliver Kell's case isn't the number 941% but the order of the procedure. Confirm the market regime first, judge the stock's stage, nail down the invalidation point before entering, and re-judge without opinion when the criterion breaks — this order is exactly the structure covered in risk management and trading psychology. The six-stage technique he made public continues with chart-identification methods in the complete breakdown of the Cycle of Price Action. But even with the same procedure, results differ completely by person, timing, and regime, and especially in leveraged crypto derivatives, a layout is possible where the account ends before the rule even executes — that's the top checkpoint when you transplant Kell's case.
FAQ
If I use Kell's method, can I make a return like 941%?
No. The 941.10% is a past, publicly reported record produced under three layers of conditions: the special regime of the 2020 growth-stock bull, one specific individual's stock account, and a one-year contest. Even the same method builds losses through consecutive stop-outs in chop and downtrends, and Kell himself said he made no money for his first several years.
What are the six stages of the Cycle of Price Action?
It's the stock-stage classification Kell made public in his book: reversal extension, wedge pop, EMA crossback, base and break, exhaustion extension, and wedge drop — six stages. The core is the order — you judge which stage you're in before making a trading decision — and the chart-identification method for each stage is organized in the Cycle of Price Action piece (/academy/kell-cycle/).
Is the 10/21 EMA a buy/sell signal?
No. The 10-day and 21-day exponential moving averages are reference tools Kell made public for judging whether a trend is holding and for reading pullbacks — not a trade instruction at any specific moment. They're closer to a state-check that says 're-judge the stage when the reference line breaks,' and for the general logic of using reference lines, see the entry and exit guide (/academy/entry-exit/).
It's a stock case — does it carry to crypto?
The procedure of stage judgment and stop-first doesn't care about the asset. But in crypto derivatives, depending on the leverage multiple, a layout can hold where the liquidation price arrives before the planned stop price, so the account can end without the rule ever getting the chance to execute. The right order is to first check the arithmetic of leverage (/academy/leverage/) and liquidation (/learn/liquidation/).