Volume Profile — Reading Volume Nodes Through the Distribution of Traded Volume by Price
Published 2026.07.06
Everyone talks about 'volume nodes' and 'supply zones,' but few people know how to actually measure them on a chart. Volume Profile stacks traded volume on the price axis instead of the time axis, giving you a graduated readout of exactly which price levels saw the most hand-changing. This guide starts with the definitions — POC, Value Area, HVN, LVN — then covers how to read thick zones differently from thin ones, and the step-by-step workflow from selecting a range to deriving targets and invalidation. One thing it won't give you: a formula like 'price bounces at the POC.' The profile is only a record of past executions — we cover that limitation honestly, along with how to supplement it with live measured data.
- Volume Profile stacks traded volume on the price axis rather than the time axis, showing which price levels concentrated the most executions — turning volume-node analysis from gut feel into measurement.
- The POC is the single most-traded price, and the Value Area is the tightest range containing 70% of total volume. Thick HVNs tend to act like magnets that hold price, while thin LVNs tend to act like corridors price moves through quickly.
- Practical application follows a fixed order: select the range, mark POC/VAH/VAL, classify where current price sits, then define scenarios and invalidation. The tool's real value is that the point where you admit you're wrong becomes a concrete level.
- The profile is a record of past executions — a volume node that has already been flushed out by stops and liquidations won't react. The gap between the record and the current distribution of positions is this technique's fundamental limitation.
Volume by Price — Stacking Volume on Price, Not Time
The standard volume bars along the bottom of a chart record when the heavy trading happened. Volume Profile takes the same data and rotates it 90 degrees to record where — at which prices — the heavy trading happened. That's the horizontal histogram lying along the side of the chart. This one rotation changes the entire perspective: a price level that saw massive hand-changing is, by definition, a price level where a huge number of accounts hold their entry. It's where break-even psychology and resting orders cluster — the volume nodes discussed in support and resistance — and Volume Profile is the tool that measures them on a graduated scale.
Crypto adds one quirk. It's a 24-hour market with no open or close, so the boundary of a 'daily profile' is blurry. That's why many traders find the Fixed Range profile — drawn over a single meaningful swing or consolidation box that you select yourself — more practical on crypto charts than date-based session profiles. This guide follows the same emphasis: not how to operate the indicator, but how to choose the range and how to read the result.
The Vocabulary — POC, Value Area, HVN and LVN
The POC (Point of Control) is the single price level with the most executed volume in your selected range. It's the longest bar sticking out of the histogram, interpreted as the price where the market spent the longest agreeing 'this is a fair place to buy and sell' during that period. The Value Area (VA) is the narrowest price range containing 70% of total volume, with the upper boundary called the VAH (Value Area High) and the lower boundary the VAL (Value Area Low). The 70% figure approximates the statistical convention that roughly 68% of a normal distribution falls within one standard deviation of the mean. If the range's total volume was 100,000 BTC, the Value Area is the zone around the POC where 70,000 BTC changed hands.
The contours of the histogram have names too. An HVN (High Volume Node) is a thick peak of executions — a price zone where the market lingered and large positions were built. An LVN (Low Volume Node) is a thin valley — a price zone that price sped through with almost no hand-changing. In practice, volume-node analysis doesn't read the POC alone; it reads the full arrangement of these peaks and valleys.
On TradingView, the Fixed Range Volume Profile (FRVP) lets you select the range yourself, the Session Volume Profile (SVP) splits automatically by date, and the Visible Range Volume Profile (VRVP) computes over whatever is on screen. VRVP changes every time you scroll, which makes it a poor analytical baseline — for any analysis that needs a fixed reference, Fixed Range comes first.
The Logic of Interpretation — Nodes Are Magnets, Gaps Are Corridors
The reason an HVN attracts and holds price isn't some mystical force — it's order density. A price zone with heavy past executions is full of positions with entries at that price, and when price revisits, orders pour in from both sides: break-even exits, add-on entries, defensive orders. While those orders absorb each other, price slows down, lingers, and rotates. Conversely, an LVN is the record of a price the market once rejected. A zone that never justified hand-changing has few orders waiting to catch price on a revisit, so it tends to get traversed quickly. 'Nodes are magnets, gaps are corridors' is the one-line summary of this structure.
The other axis is the distinction between acceptance and rejection. When price pokes outside the Value Area but fails to hold and comes back inside, it tends to rotate all the way to the opposite boundary — an observation the Market Profile community calls the '80% rule.' Conversely, when fresh volume builds outside the VA and price is accepted there, the market is read as having agreed on a new price zone, and the phase is classified as trending. This lens — separating rotation inside the box from escape out of it — maps precisely onto reading accumulation ranges in Wyckoff.
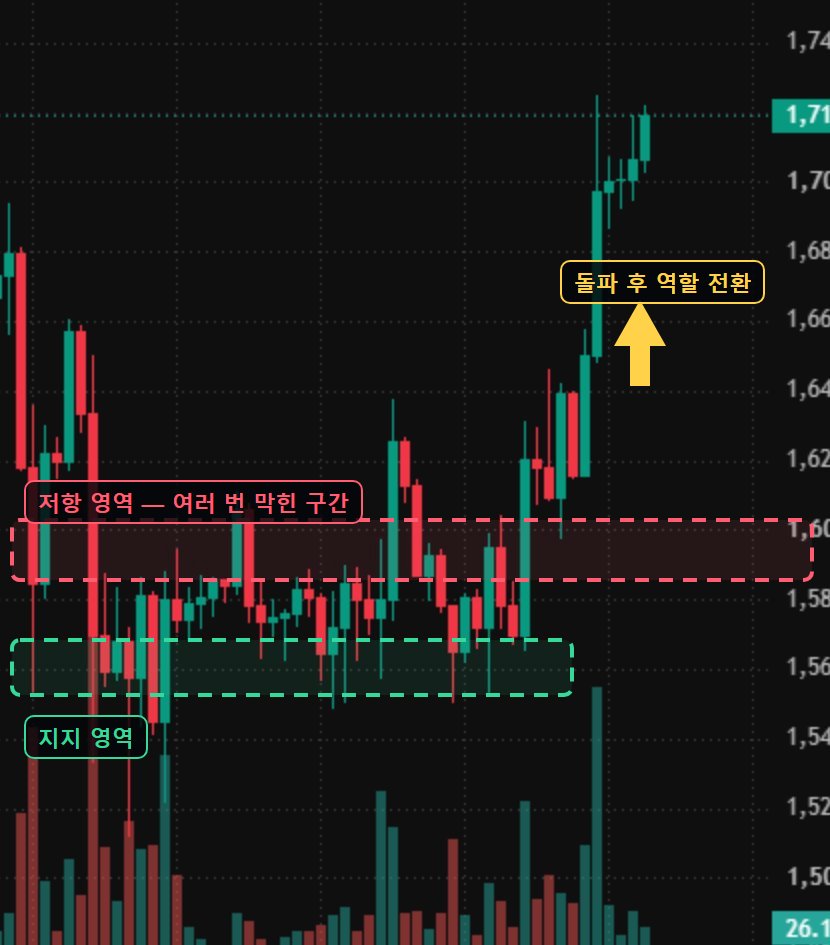
The caveat: all of this is a statement about tendencies. The 80% rule is a summary of past statistics, not a law, and LVNs don't always become express corridors. The profile tells you how price behaved here — it does not guarantee how price will behave next. What bridges that gap is the workflow in the next section: scenarios and invalidation.
Volume Profile is price's résumé — a record of where the market agreed, and where it was rejected.
The Practical Workflow — From Range Selection to Target Derivation
Half of a profile's output is determined the moment you choose the range it's drawn over. That's why the first step of the workflow is range selection, not indicator settings — and the last step is invalidation definition, not prediction. Reconstructed for learning purposes, the standard procedure traders use looks like this.
- Select the range — draw a Fixed Range profile over a structurally meaningful segment, not an arbitrary period. One full swing from the prior swing low to the high, or the entire consolidation box currently in play, is standard.
- Mark the three levels — draw horizontal lines at the POC, VAH, and VAL. These three lines are the skeleton of the range.
- Mark HVNs and LVNs — add at most two or three peaks and valleys each. Mark everything and the map becomes scribble.
- Classify current price — if price is inside the VA, classify the phase as rotational (boundary to opposite boundary); if it's been accepted outside the VA, classify it as breakout/trend. The set of valid scenarios changes with the location.
- Define scenarios and invalidation — write down in advance the reaction you expect at each level, and which level, once broken and accepted on a candle body, kills the scenario. Levels without invalidation aren't analysis — they're decoration.
- Cross-check the higher timeframe — check whether the 4-hour profile's levels overlap the daily profile's HVNs and LVNs. When two timeframes point at the same price, the level's reliability goes up.
Say you draw a Fixed Range profile over BTC's move from $60,000 to $66,000 and get POC 63,200 / VAH 64,800 / VAL 61,900, with an LVN valley at 61,300–61,600 just below the VAL. If price pulls back to around 62,000 near the VAL and holds without being accepted below it, traders run the numbers like this: invalidation is a break below the LVN floor at 61,300 (700 dollars away); the first mean-reversion target is the POC at 63,200 (1,200 dollars away) for roughly 1:1.7; and the far side of the VA at VAH 64,800 makes it 2,800 dollars for a 1:4 structure. The point is not predicting the bounce — it's that the levels define the distances of risk and reward before anything else.
It's worth stressing again that invalidation is defined by profile levels. In the example above, if price breaks 61,300 on a candle body and executions start building below it, the very same logic — 'thin zones are corridors' — now works in the downward direction. This is the moment the same tool starts supporting the exact opposite scenario, and discarding the earlier scenario without hesitation is part of the procedure. In a leveraged market, the cost of postponing invalidation is billed not as a loss but as a liquidation.
Limitations — A Record of the Past Guarantees Nothing About the Future
The most fundamental limitation is that the profile is backward-looking. A peak in the profile is only a record that heavy volume traded at that price back then — not evidence that those positions are still alive. If the trapped inventory has already been flushed out through stops and liquidations, the chart still shows a thick HVN, but the orders that would actually react are long gone. The record and the current distribution of positions are two different things, and the profile cannot tell them apart.
The second is discretion in range selection. Anchor the range at the swing low versus the box just before it, and the POC moves by hundreds of dollars. If different people draw different profiles on the same chart, success or failure hinges on discretion rather than the tool — a reproducibility problem with the same structure as the criticism leveled at SMC order blocks. And on a hindsight chart, any range you pick produces plausible-looking levels, which feeds confirmation bias.
① Trusting stale profiles — a volume node from months ago has likely been cleared out already. The older the range, the more the level's validity needs separate confirmation. ② Expecting the LVN express lane — thin zones don't always get traversed quickly. If fresh executions build mid-transit and a new HVN forms there, the corridor scenario is void. ③ Inferring derivatives positioning from spot volume — in crypto futures, the real liquidity often clusters at liquidation prices, not in the execution record. Assuming a spot profile shows you the full supply map of a leveraged market is dangerous.
Even so, it's not a tool to throw away. The core structure — prices that saw heavy executions attract renewed attention on a revisit — is a repeatedly observed fact, and the practical value of defining invalidation by level rather than by whim is real. The problem is exactly one thing: the profile alone cannot answer whether that volume node is still alive. That question requires measured data.
Whale Story's Measured Data — Actual Entry Distributions, Not Estimated Nodes
The ultimate question in volume-node analysis is: at which price, how large a position, is still trapped right now? Volume Profile estimates this from past volume, but Whale Story's whale levels plot the actual entries and liquidation prices of top Hyperliquid whales directly on the chart. Not an estimate — a measured distribution of live positions, publicly visible on-chain.
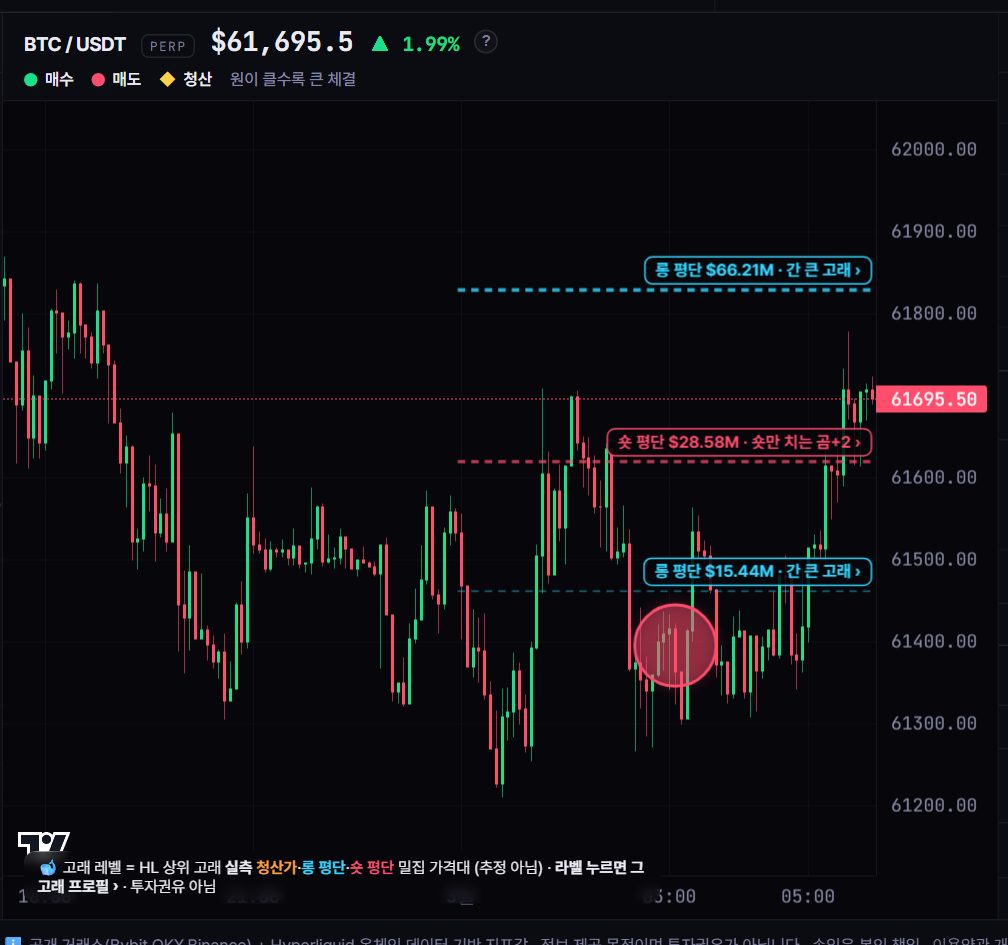
The two datasets verify each other. If whale entries actually cluster near a profile HVN, that node is likely still alive; if the HVN is thick but no large positions remain at that price, you have grounds to suspect a hollow node — a record with nothing behind it. On top of that, zones dense with liquidation prices are volume nodes the profile can't see at all — prices where nothing has ever traded, yet the moment they're hit, uncancelable forced orders come pouring out. Only when the record of past executions is overlaid with the measured state of current positions does the volume-node map become three-dimensional.
The volume nodes that Volume Profile 'estimates' from execution records can be cross-checked against measured data on Whale Story. The live tracker's whale levels overlay the actual entries and liquidation prices of top Hyperliquid whales on the chart, and in past observations, price deceleration and rotation appeared repeatedly at price zones where profile HVNs overlapped clusters of whale entries — while volatility amplification has also been observed as price approached zones where liquidation prices stacked up like a staircase, a forced-order volume node invisible to the profile. The smart-money tracker lets you gauge whether inventory at a given price zone is still alive from the movements of verified smart-money wallets. These are tendencies in past data only, and guarantee neither a reaction nor a direction at any specific level. → Suspected-top signals · What is liquidation?
FAQ
How is Volume Profile different from a regular volume indicator?
The axis is different. Regular volume stacks on the time axis and shows when the heavy trading happened; Volume Profile stacks on the price axis and shows at which prices the heavy trading happened. For work that assigns meaning to specific price levels — like volume-node analysis — the price-axis distribution is the direct evidence.
Why is the Value Area 70%?
It approximates the statistical convention that about 68% of a normal distribution falls within one standard deviation of the mean. It's a traditional setting carried over from Market Profile theory, not a magic number, and depending on the tool you can adjust it to 68% or another value. What matters is the concept — the zone where the market agreed on most of its trading — more than the number itself.
Over which range should I draw the profile?
A structurally meaningful segment, not an arbitrary date range. The standard is a Fixed Range profile over one full swing from the prior swing low to the high, or over the entire consolidation box currently in play. Because the POC shifts significantly with the anchor point, the key to reproducibility is defining your range-selection criteria in advance and applying them consistently.
Does price bounce when it reaches the POC?
There is no guarantee. The POC is only a record of the price that traded the most volume in the past, and if that inventory has already been cleared out, price can pass through with no reaction at all. The accurate use of profile levels is not to predict reactions, but to define where to watch for them — and where the invalidation point sits if the scenario is wrong.
Should I use Whale Story's whale levels or Volume Profile?
They're different kinds of data, not substitutes. The profile is the distribution of past executions; whale levels are the measured entries and liquidation prices of top whale positions that are alive right now. Whale Story is an observation tool that presents this data as-is and does not recommend any specific trade. Investment decisions and their outcomes are your own responsibility.