Order Flow & CVD — How to Read the Trades Behind the Candle
Published 2026.07.03 · Updated 2026.07.06
If you searched for CVD and landed here, you already know candles and volume alone aren't enough. The problem is that most material stops at the introduction — "CVD shows buying and selling pressure" — and never teaches the part that matters: the order in which to check it against the chart, and where to throw the interpretation away. This article breaks down how CVD is actually computed, then walks through the four-quadrant procedure for reading price against CVD, the three conditions for calling absorption, and the situations where this data betrays you. One illusion is worth clearing away up front — order flow is not a window into smart money's intentions; it's circumstantial evidence that shows only what the other side failed to hide.
- CVD (Cumulative Volume Delta) accumulates, in chronological order, the delta of taker buy volume minus taker sell volume — a running balance of 'who paid a cost to get filled in a hurry.'
- The heart of the read is the four-quadrant combination of price direction and CVD direction. The two quadrants where they disagree (price up with CVD down, price down with CVD up) are the circumstantial evidence for exhaustion and absorption.
- Absorption is when aggressive prints pour in yet the price reaction is abnormally small; convention is to suspect it only when three conditions overlap — delta size, price reaction, and order-book walls that keep refilling.
- CVD is a relative indicator computed separately per exchange and market, and it's vulnerable to spoofing and iceberg orders — so it's used not as a standalone signal but as confirming evidence layered on top of location (volume nodes and levels).
Price Is the Result — The Process That Trade Data Reveals
A single candle is the summary left behind after hundreds to thousands of trades are done. Its four numbers — open, high, low, close — record only 'how far it went,' erasing who pushed with market orders along the way and who caught them with limit orders. If candles and volume are the grammar of results, order flow analysis is the technique of reading the process that produces those results — the raw trades themselves. Two green candles can look identical, yet one driven up by aggressive buying and one that slid upward because the offers thinned out carry structurally different implications for what follows.
The lineage runs back more than a century. Its origin is tape reading from the ticker-tape era: in the early 1900s, Richard Wyckoff systematized how to read the footprints of big players accumulating and distributing off the trade tape, and in the 1980s, Peter Steidlmayer at the Chicago Board of Trade devised Market Profile, which reads how trading is distributed across price levels. The reason this old craft got a second life in crypto is data access. Major exchanges stream their full trade history in real time over public APIs, so the trade delta and large-print tracking that were once the preserve of institutional terminals are now visible to any individual, unfiltered.
Price is the conclusion, and the trades are the argument that reaches it — order flow is the craft of finding the holes in the argument.
How CVD Is Built — The Cumulative Gap Between Aggressive Buying and Selling
First, pin the vocabulary down. Every trade has two parties. The maker is the side that posts limit orders into the book to supply liquidity; the taker is the side that removes that liquidity on the spot with a market order. The taker accepts a worse price and a higher fee just to get filled right now — the taker is the urgent side. What order flow counts is precisely the direction of that urgent side.
Every trade matches a buyer and a seller exactly 1:1, so by total volume, the claim that buying outweighed selling never holds. In order flow, buy-side dominance means the takers' direction tilted toward buying — the tally of market buys lifting the offers outpaced the market sells hitting the bids. Miss this distinction and you'll be misreading CVD the whole way through.
Delta is taker buy volume minus taker sell volume over a given window. If, during one minute, 420 BTC traded as taker buys and 300 BTC as taker sells, that minute's delta is +120 BTC. CVD (Cumulative Volume Delta) is the curve that keeps summing that delta in chronological order. If the next minute's delta is −80 BTC, CVD steps down from +120 to +40. If the price chart draws 'how far it went,' CVD draws the running balance of 'who was aggressive on the way there.'
One practical rule falls straight out of this. CVD's absolute level is an arbitrary number that depends on where the accumulation starts. That's why order flow traders read CVD not as a number but as a trajectory — is the slope holding, and do CVD's new extremes keep pace with price's new extremes? The unit of the read isn't the value; it's the shape relative to price.
The Four-Quadrant Read — What Price and CVD Say Together
Overlay price direction on CVD direction and you get four combinations. The two where the directions agree are alignment — confirmation that aggressive orders are pushing price exactly as expected. The raw material for a read is the other two: the quadrants where price and CVD pull apart.
① Price↑·CVD↑ = aligned advance. Aggressive buying is driving the rise. ② Price↓·CVD↓ = aligned decline. Aggressive selling is driving the drop. ③ Price↑ with CVD↓ or flat = a stretch rising without market buying — read as thinned-out offers or short-covering in character, or as circumstantial evidence that the rally's fuel is running out. ④ Price↓ with CVD↑ or flat = aggressive buying keeps coming yet price still slides — evidence that a hand above is passing out inventory via limit orders (suspected distribution); conversely, near the lows, when falling price, a heavily negative delta, and a muted price reaction overlap, the read splits toward suspected absorption.
Run the divergence read with numbers and it goes like this. Say BTC clears its prior swing high of $71,800 and prints a new high at $72,400, roughly +0.8% — but the CVD high over the same stretch comes in below its prior high. The aggressive buying that built the new high was smaller than on the previous leg, which is exhaustion evidence: the advance is leaning on thinned-out offers rather than taker power. Conversely, if a new price low isn't matched by a lower CVD low, that's evidence of aggressive selling exhausting itself. One caveat — this is an observation of shrinking fuel, not a reversal forecast. In strong trends, it's common for divergences to print several times over while the trend keeps going.
- Fix the source — pick one exchange and one market (spot or futures) and lock your CVD source. Different sources produce differently shaped curves, making comparison meaningless.
- Location first — on a higher timeframe, define your price levels of interest first: volume nodes, prior extremes. CVD isn't something you stare at anywhere and everywhere; it's a magnifying glass you pull out when price reaches a level you've already chosen.
- Pair the extremes — match price swing highs and lows 1:1 with the CVD extremes from the same stretch and mark them. Comparing extremes from different legs is the most common mistake.
- Classify the quadrant — label the current stretch aligned or divergent, and if divergent, write down which hypothesis it fits: exhaustion, distribution, or absorption.
- Wait for confirmation — never judge on divergence alone. Traders treat it as an observation window until a shift in price structure (such as a break of the prior swing) follows.
- Define invalidation — if price prints another new high and CVD prints a new high along with it, the exhaustion hypothesis is discarded on the spot. Log the hypothesis and the outcome and turn it into your own data.
Absorption — The Hand Catching the Flood of Selling
Absorption is often called the crown jewel of order flow analysis. If market sells pour in by the ton yet price barely gives way, that's evidence a big player is continuously catching that size with limit orders at a specific price level. Wyckoff-school analysis has long described this as a hallmark footprint of accumulation, and a good share of the zones that SMC calls order blocks turn out, in hindsight, to be places where absorption occurred. There's a mirror image too — when aggressive buying gets quietly absorbed from above and price can't push any higher, it's read as evidence of distribution (offloading inventory).
① Delta size — delta prints deeply negative (taker sell dominance). ② Price reaction — the drop is abnormally small relative to that size. ③ Refilling walls — the buy wall at a specific price keeps getting consumed by fills yet keeps getting rebuilt. Order flow traders suspect absorption only when all three overlap; without ③ in particular, it can't be distinguished from a decline that's merely slow.
Numbers make the call sharper. Suppose the previous down leg took −1,000 BTC of delta and pushed price 1.5% lower, while this stretch soaked up −1,400 BTC of delta yet slipped only about 0.2%, from $68,300 to $68,150. Price reaction per unit of delta shrank to roughly a tenth (0.0015%/BTC → about 0.00014%/BTC) — a bigger attack producing a smaller result is the core arithmetic of absorption evidence. When traders move this observation into a structure, they compute R first — if the bottom of the absorption zone at $67,900 breaks, the hypothesis is wrong; from an observation basis near $68,100, the distance to invalidation is about 0.3% and the distance to the prior high at $69,000 is about 1.3%, so the question becomes whether a risk-reward structure better than 1:4 actually holds. If the structure doesn't hold, the observation stays just that — an observation.
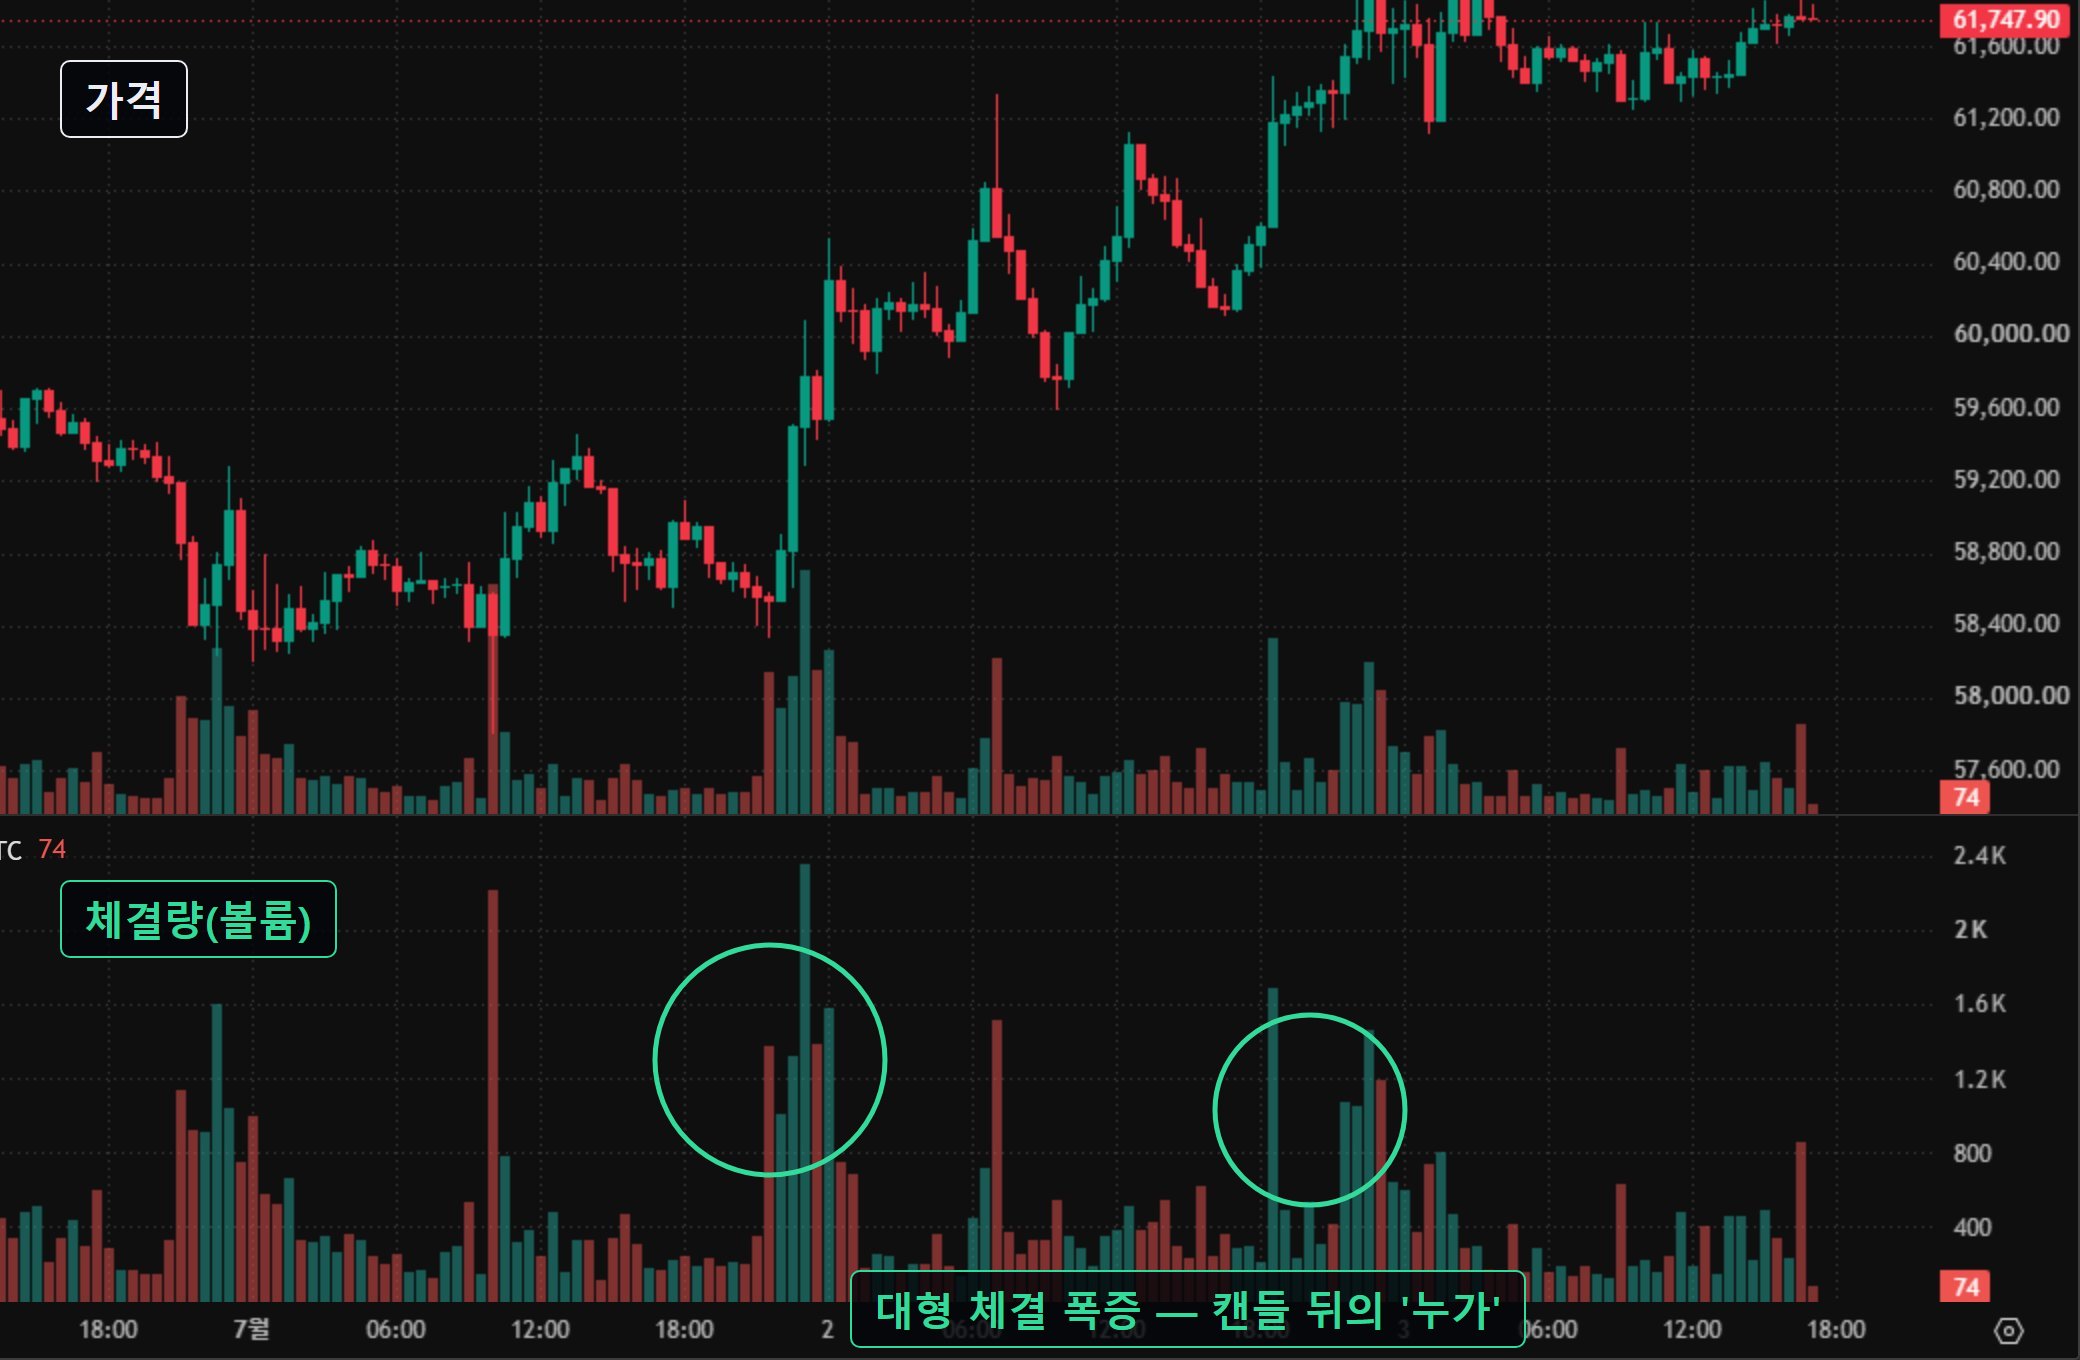
Reading large prints follows the same principle. A single trade far above average, or a cluster of trades packed into a short window, catches the eye — but it isn't directional information in itself. Trades with no directional intent behind them — spot hedges, cross-exchange arbitrage, forced liquidation — also print large. Delta inside a liquidation cascade in particular is a record of forced orders, not voluntary ones, so the safe way to read large prints is not as a 'who and why' narrative but as positional information — which price level do they keep clustering at?
The Traps — Spoofing, Per-Exchange Data Differences, Reproducibility
The first trap is CVD's relativity. CVD is computed separately per exchange and per market, so Binance futures CVD and another exchange's spot CVD can differ not just in value but even in direction, and where the accumulation starts changes the curve's height as well. The moment you step outside the rule — compare only slope and extremes within the same source — you're adding up lengths measured with different rulers. In thin-liquidity markets like altcoins, a single large print can bend the entire CVD, and its statistical meaning evaporates outright.
The second trap is that the other side can manipulate the data. Spoofing — posting large limit orders with no intent to fill and then canceling them — is a market-manipulation tactic that has led to criminal prosecution in U.S. regulated markets, and the existence of prosecutions means the tactic has genuinely been in use. Iceberg orders do the opposite: they slice real size into small pieces and expose only a little at a time. In other words, the order book is a screen that can be engineered so that fake size looks big and real size looks small — and large capital's execution algorithms are built to hide their tracks in the first place.
① Divergence in front of a trend — in a strong trend, exhaustion evidence prints back to back and the trend continues anyway. Standing against the trend on divergence alone is this technique's signature misuse. ② Vanishing walls — a buy wall that looked like absorption can disappear by cancellation at the decisive moment. On a screen that can't distinguish a wall being consumed from a wall being canceled, withhold the absorption call altogether. ③ News and violent moves — when liquidity momentarily empties out, a handful of trades distort the entire dataset. ④ Forced-fill contamination — delta in liquidation-heavy stretches is a record of forced mechanisms, not psychology. Trade data in leveraged markets has to be read with this contamination assumed.
The most fundamental limit is reproducibility. Public backtests independently validating an order flow edge are rare — tick-level data is so vast that reproduction is hard, and absorption and exhaustion calls involve so much discretion that people watching the same screen reach different conclusions. That's why, in practice, CVD is used not as a standalone signal but as a confirmation layer on top of location (volume nodes, whale levels) and derivatives indicators. Cross-checking positioning skew is the job of funding rates and open interest. No combination removes the possibility of loss, and no amount of accumulated evidence ever becomes certainty.
Observed on Whale Story — The Large-Print Tape in Real Time
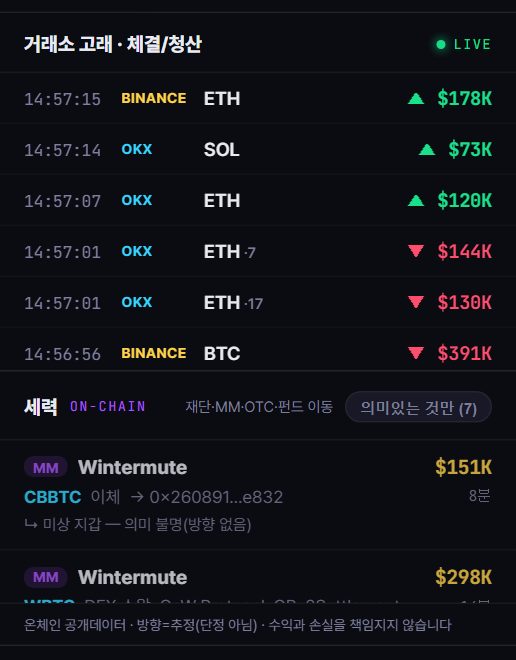
Every tool in this article can be checked directly on Whale Story's live tracker, built around crypto futures. Toggle on CVD and the cumulative curve of Binance taker delta overlays the price chart, letting you eyeball the four-quadrant classification against it, while the large-print bubble map filters Bybit and OKX live fills down to the big ones and shows which price level and which direction they cluster in. In the order-wall panel, you can watch whether a wall is being consumed by fills (absorption evidence) or vanishing by cancellation (suspected spoofing) — the screen that puts condition ③ of the absorption test under direct observation.
The recommended routine is simple. Set your levels of interest on a higher timeframe, and only when price approaches them, open the tape, CVD, and the order walls together, log your hypothesis, and compare it against the outcome. Staring at second-by-second prints all day long is a shortcut straight into the overtrading loop covered in the scalping guide. And before imagining who's behind a large print, reading what a whale is helps you treat the big numbers on the tape as data rather than narrative.
Every read covered in this article can be checked against live observation on Whale Story. On the live tracker, the CVD toggle overlays the cumulative curve of Binance taker delta onto the price chart so you can test the four-quadrant classification in real time, and viewing the large-print bubble map together with the order-wall panel lets you distinguish whether a wall is consumed by fills or vanishes by cancellation — absorption evidence versus suspected spoofing. In past observations, stretches late in sharp rallies where a new price high coincided with a lower CVD high have repeatedly overlapped with suspected-top signals switching on, and on the on-chain side, you can cross-check whether verified wallet movements in the smart-money tracker coincide in timing with large-print clusters. All of this, however, is observation and aggregation of past trades, and guarantees no future price or specific outcome.
FAQ
Where can I see the CVD indicator?
In TradingView community indicators, dedicated order flow platforms, and the CVD toggle on Whale Story's live tracker (based on Binance taker delta). Keep in mind that CVD is a relative indicator computed separately per exchange and market, so it's only meaningful when you compare slope and extremes within the same source.
If price is falling but CVD is rising, is that smart-money accumulation?
You can't conclude that. The data only tells you that aggressive buying keeps getting soaked up by limit orders above; whether that party is accumulating smart money or hedging/arbitrage flow can't be distinguished from trade data alone. Convention is to treat any absorption or accumulation read purely as a hypothesis for when three conditions overlap — delta size, price reaction, and refilling order-book walls.
Does a CVD divergence mean a reversal is coming?
No. A divergence is not a reversal forecast but an observation that the fuel behind the move is shrinking, and in strong trends it's common for several divergences to print in a row while the trend continues. That's why traders wait to confirm whether a shift in price structure follows, and predefine an invalidation rule: if price and CVD make new highs together, the exhaustion hypothesis is discarded.
Will learning order flow make me profitable?
No analysis technique guarantees profit, and order flow is likewise a skill for handling probabilistic circumstantial evidence. Independently validated public backtests are also rare. This article is for educational and informational purposes and does not recommend any specific trade or entry. Leveraged trading can lose your entire principal, and every decision and its outcome are your own responsibility.