Why You Get Liquidated — the Mechanics of Forced Liquidation and How to Prevent It
Published 2026.07.01 · Updated 2026.07.06
Almost everyone who has been liquidated ends up searching the same question — "why did price come down to exactly my liquidation price and then bounce?" This piece answers that question with structure, not luck or conspiracy. In order, it dissects the machinery by which maintenance margin draws your liquidation price, the four mistakes retail traders repeat, and how a cascade works — one liquidation setting off the next. And it shows, with a numbers-included procedure, that liquidation is not an event you react to after it happens but one you prevent by design before you enter.
- Liquidation is not a random accident. The moment you open a position, maintenance margin rules automatically draw your liquidation price, and when price touches that line the exchange engine closes the position mechanically.
- The recurring mistakes boil down to four — running high leverage that erases your margin for error, averaging down and growing your exposure, skipping the stop and outsourcing your exit to the liquidation engine, and chasing into the tail end of crowding, joining the cluster of stacked liquidation prices.
- A forced liquidation is a market order that cannot be canceled, so it pushes price in the same direction, and the pushed price touches the next liquidation cluster, spreading the chain (the cascade). The feeling that 'the market is hunting my liquidation price' is really this clustering structure.
- Prevention is finished before entry — an invalidation point, a per-trade loss cap, and position size computed backward from the stop distance. Design in that order and your liquidation price always sits behind your stop.
The machinery of liquidation — the line maintenance margin draws
Forced liquidation is the procedure by which an exchange closes a losing leveraged position before the margin is entirely gone. There is no emotion and no judgment involved. The moment you open a position, your liquidation price is computed automatically under the maintenance margin rules, and when price touches that line the liquidation engine executes mechanically. In other words, liquidation is not 'an accident that struck because the market turned ugly' — it is closer to a conditional order booked the instant you enter. If the basic terminology is unfamiliar, start with What Is Liquidation.
Numbers make it obvious. Open a long with $1,000 of margin at 10x leverage and the notional position is $10,000. By naive math, price would have to move -10% to wipe out the full $1,000 of margin — but in practice it ends before that. If the maintenance margin rate is 0.5% of notional, the exchange executes the liquidation the moment your remaining margin drops below $50. That is the point where your loss reaches $950 — roughly -9.5%. Add the liquidation fee on top, and there is always a gap between 'how far you can theoretically withstand' and 'where you actually get liquidated.'
Your distance to liquidation is roughly the inverse of your leverage — 5x is about -20%, 10x about -10%, 25x about -4%, 50x about -2%. Because of maintenance margin and fees, actual liquidation arrives a bit earlier than these figures. Crypto routinely moves 4-5% in a day even without any major event, so at high multiples it is not a crash but an ordinary day that becomes grounds for liquidation. The math behind each multiplier is covered in detail in the leverage chapter.
The four recurring mistakes — high leverage, averaging down, no stop, chasing the crowd
The first mistake is high leverage. Raising the multiplier looks like a choice to amplify profits, but structurally it is a choice to shrink 'the margin for error you are allowed when wrong.' At 25x, a routine -4% pullback ends the account. The second mistake is the missing stop. Not placing a stop-loss order is the same as handing the entire decision to close your position over to the liquidation engine. A forced liquidation executes not at a spot you chose but at the worst possible one — at market, with a liquidation fee on top.
The third mistake is averaging down. Open a 1 ETH long at $3,000, and when price falls -5% to $2,850, adding another 1 ETH brings your average entry down to $2,925. It looks like breakeven just moved $75 closer. But if price drops another 5% to $2,707, your loss on 2 ETH is roughly $436 — 1.5 times the $293 you would have lost without adding, and from this point your loss compounds at exactly twice the speed. You bought a faster rate of account destruction and paid for it with a lower average entry. The problem is that this arithmetic keeps getting repeated, hidden behind the psychology of 'just a small bounce and I'm back to breakeven.'
The fourth mistake is chasing the crowd. Jumping in at the tail end of a spike is not merely a problem of buying high. It is a problem of your liquidation price overlapping in the same band as countless other accounts that entered the same zone in the same direction. Stretches where the funding rate spikes to one side have been read as a signal that this kind of crowding is building (What is the funding rate?). Why that clustering is dangerous is what the cascade structure in the next section explains.
Liquidation begets liquidation — the anatomy of a cascade
An individual's mistake does not end at the individual's account. The decisive property of a forced liquidation is that it is a market order that cannot be canceled. A stop order can be canceled or moved; a liquidation must fill the moment its condition is met. A long liquidation is a market sell that drags price further down, and that drop touches the liquidation price of the next account sitting just below.
The sequence is mechanical. ① Many traders stack high-leverage positions in the same direction, so liquidation prices overlap in a narrow band → ② price moves slightly the other way and the first liquidation fires → ③ the liquidated size dumps at market, pushing price further in the same direction → ④ the pushed price touches the next cluster and triggers more liquidations. This chain is what produces the flash drops of -10% or more in a matter of minutes, and the long wicks they leave behind. In this structure, the individual trader is both the fuel and the casualty.
Crypto futures allow far higher leverage than equity markets, trade 24 hours without pause, and have no buffers like circuit breakers. The tool for estimating where liquidation clusters are forming is the liquidation heatmap, and how to read it is covered separately in the liquidation heatmap chapter.
The truth behind 'the market is hunting my liquidation price'
The experience of price bouncing right after your liquidation is astonishingly universal. That is why the interpretation 'smart money is watching my liquidation price' gains traction. But the explanation needs no conspiracy. Your liquidation price is not a value you chose arbitrarily — it is a value that lands in the same place for anyone with the same entry zone and the same multiplier. If thousands of people opened 10x longs near the prior low, thousands of liquidation prices stack up in the narrow band just below that low. Price did not touch 'your liquidation price' — it touched the band where everyone's liquidation prices are crowded.
Layer the logic of liquidity on top. Whoever needs to move large size needs a spot where opposing orders are dense, and a liquidation cluster is the most reliable fill venue there is — a stack of orders that cannot be canceled. That is why the move where price briefly stabs through a cluster just beyond an extreme and snaps back is observed unusually often in derivatives markets. Whether to read that move as intent or as a byproduct of structure is debated, but the fact that forced orders stack up beyond the extremes is the part confirmed by data. The chapter that dissects this structure is the stop hunt.
The market does not know your liquidation price. It is just that the liquidation prices of the thousands who entered where you did are stacked in the same band.
The prevention procedure — three things you fix before entry
Liquidation is not something you fend off after the position is already in danger — it is something you design out before entry. What long-surviving traders have in common is not predictive skill but the discipline of keeping this sequence. Fix three things before entering, and if you cannot answer even one of them, put the entry itself on hold.
- Anchor the invalidation point to structure — first define, from chart structure (the prior low, the bottom of the range, and so on), the level where 'if this breaks, my scenario is wrong.' Your stop price comes from here. A position opened without an invalidation point is not a plan — it is exposure.
- Size the position backward from your per-trade loss cap — with a $5,000 account, if you allow 1% ($50) per losing trade and the distance to invalidation is 2.5%, the position is capped at $50 ÷ 0.025 = $2,000 notional. At 10x, that takes just $200 of margin. The multiplier is not something you pick first — it falls out of this calculation.
- Verify the liquidation price always sits behind the stop — in the example above, the stop is at -2.5% and a 10x position's distance to liquidation is about -9.5%. If you can confirm the stop fires well before liquidation, you pass; if the liquidation price is closer than the stop, the multiplier or the size is wrong. That there is no averaging-down plan is also locked in at this step.
This design only lowers the probability of liquidation structurally; it does not eliminate losses. In extreme volatility, stop orders can fill with heavy slippage far from the intended price, and in a crash gap or an exchange outage the stop may not fire at all. And even with rules in place, humans break them after a losing streak. The premise does not change: leveraged trading is an activity in which you can lose all of your invested capital even with the design fully followed. Loss caps and account-level controls continue in the risk management chapter.
Whale Story's live readings — see the liquidation map directly
Where liquidation clusters sit is usually 'estimated' with a heatmap, but on-chain exchanges go one step further. On Hyperliquid, every position is public on-chain, so you can read the actual liquidation prices and average entries of the top whales directly. You are looking at the liquidation map in measured values, not estimates.
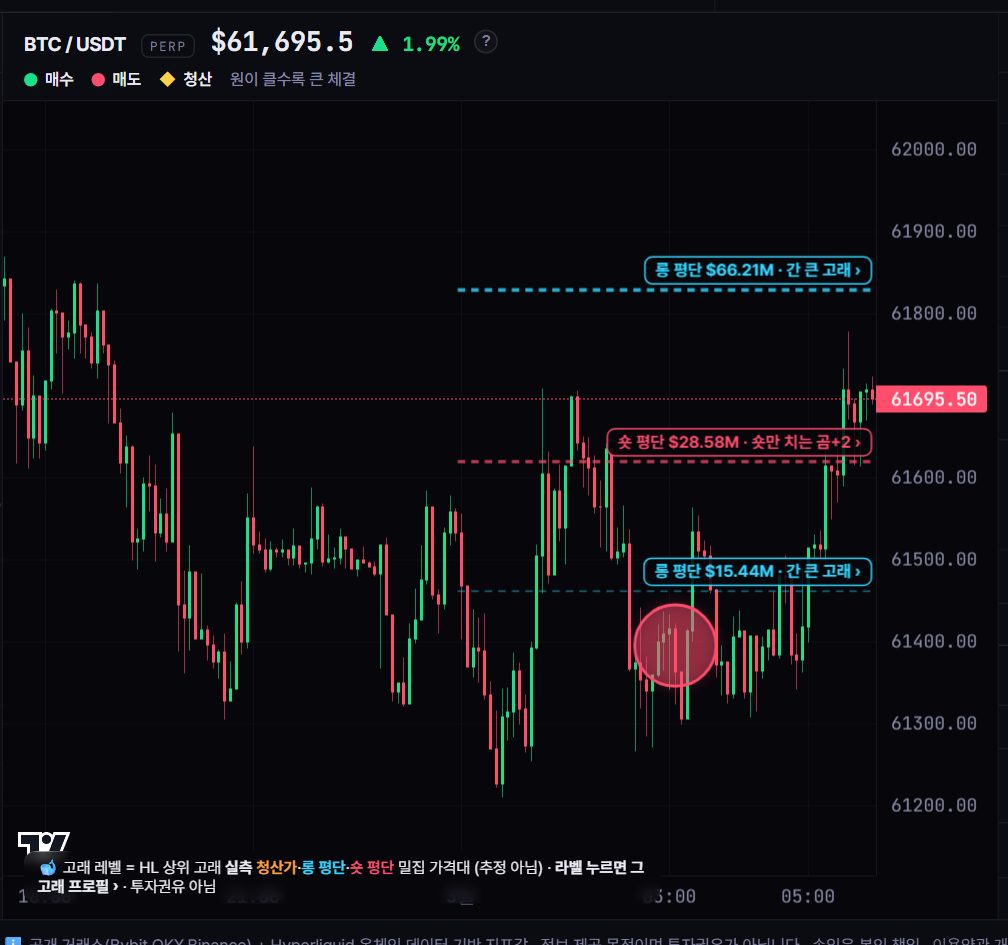
You read it exactly the way this article is structured. Bands where liquidation-price labels stack layer upon layer in a narrow range are the potential ignition points of a cascade, and if your own position's liquidation price overlaps that cluster, it means 'you are exposed in the same spot, in the same direction, as everyone else.' The limits are just as clear — this is a sample of observable top wallets, not the whole market, and price approaching a cluster guarantees neither liquidation nor a reversal. That volatility amplification near clusters has appeared repeatedly in past observations is as far as the data goes.
Whale Story's live tracker shows this article's structure in measured data. At the whale level, the actual liquidation prices and average entries of Hyperliquid's top whales are plotted on the chart, and in past observations, liquidations firing in clusters and leaving long wicks appeared repeatedly near bands where liquidation prices were stacked layer upon layer in a narrow range. Crowding buildup during sharp rallies can be observed in suspected-top signals, and the movement of large capital itself in the smart-money tracker. That said, these are tendencies in past data only; they do not predict or guarantee liquidations in any specific band or the direction of price.
FAQ
What's the difference between a liquidation and a stop-loss?
A stop is an order you place at a price you chose; a liquidation is a closure the exchange forces the moment the maintenance margin condition is met. You can position and cancel a stop, but a liquidation allows neither — and it usually fills at market, at the worst possible price, with a liquidation fee on top. Opening a position without a stop is the same as handing your exit decision to the liquidation engine.
At how many x does leverage become dangerous?
There is no safe multiplier that works for everyone. A judgment framework emerges when you overlay two facts: the distance to liquidation is roughly the inverse of the multiplier (10x about -10%, 25x about -4%), and crypto's routine volatility runs 4-5% in a day. The traders who survive do not pick the multiplier first — they compute position size backward from the stop distance and loss cap, and let the multiplier fall out as a result.
Which is less dangerous for liquidation — isolated or cross margin?
They differ in character; neither is safe. Isolated margin risks only the margin assigned to that position but puts the liquidation price closer, while cross margin makes your whole account the collateral — the liquidation price moves further away, but one failed position can drag the entire account down with it. The structural differences are covered in detail in the leverage chapter.
If I follow the procedure in this article, can I avoid liquidation entirely?
No. The invalidation point, loss cap, and backward sizing are a design that structurally lowers the probability of liquidation — nothing more. Under slippage, crash gaps, or exchange outages, the stop may not work as planned. Even large whales have been observed getting liquidated in sharp moves, and leveraged trading is a high-risk activity in which you can lose all of your invested capital.