Oliver Kell's Cycle of Price Action — How to Tell Which Stage You're In
Published 2026.07.01 · Updated 2026.07.06
If you searched for Oliver Kell, you probably wanted to know what method the winner of the 2020 US Investing Championship actually uses. The answer is a surprisingly simple framework — the 'Cycle of Price Action,' which divides the way price is born at a bottom, runs, overheats, and collapses into six stages. The problem is that most write-ups list the stage names and stop there. This article goes the other way. It works through how to recognize each stage on a chart, where traders look for entry candidates and where they admit they're wrong, and what changes when you carry this stock-based framework into a leveraged, 24/7 crypto market — all organized around the identification procedure itself.
- Kell's cycle rotates through six stages — Reversal Extension → Wedge Pop → EMA Crossback → Base 'n Break → Exhaustion Extension → Wedge Drop — and the identification axis is how price treats the 10- and 20-period EMAs (extension, reclaim, support, breakdown).
- In the early transitions (Wedge Pop, Crossback) traders look for entry candidates; in the last two stages (Exhaustion Extension, Wedge Drop) they look for reasons to trim and stand aside — and each stage carries a different invalidation point.
- The real payoff of stage classification isn't prediction — it's knowing where you are. The same breakout carries an entirely different probability structure depending on whether the cycle is just beginning or nearly over.
- The framework has clear limits — it's backward-looking, and labeling involves discretion — and Kell's own results came out of the exceptional 2020 bull market, which has to be factored in before using it.
Price as a Cycle — Kell's Map of a Trend's Life Span
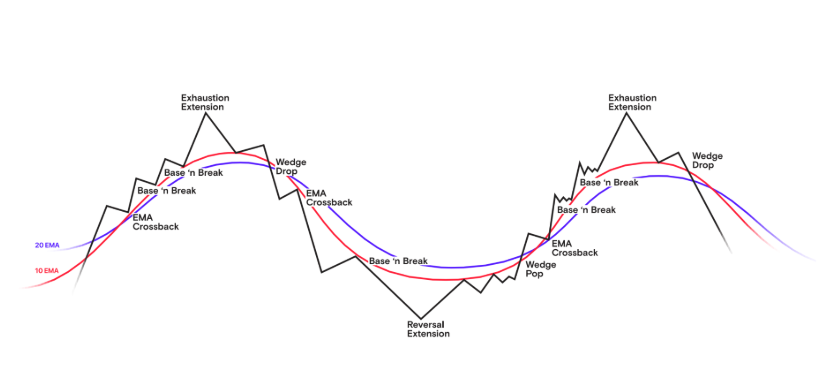
Oliver Kell is the trader who won the 2020 US Investing Championship with a +941% annual return. The framework he published turns on a single question — "Where in the life span of its trend is this name right now?" He divided the move into six stages based on how price treats the 10- and 20-day exponential moving averages (EMAs): whether it stretches far below them, reclaims them from underneath, pulls back and finds support on them, extends too far above them, or breaks down beneath them. His background and the trades behind that championship run are covered separately in the Oliver Kell case study.
What makes this framework matter at the intermediate level isn't any individual pattern — it's the sequence it provides. A Wedge Pop only means something after a Reversal Extension, and a Base 'n Break only reads as a 'continuation' signal once a Crossback has confirmed the trend. The exact same breakout shape is a candidate for the start of a new trend if it appears early in the cycle, but carries the probability structure of a last-call trap if it appears after an Exhaustion Extension. Identifying the stage ultimately means pricing the same signal differently depending on where it occurs.
In this framework, an EMA touch is not a buy or sell instruction. The EMAs are reference lines for measuring the distance between price and its trend, and every stage boundary is drawn from changes in that distance. If you read each stage below through one lens — 'which direction is the extension, and how far' — the six stages connect into a single flow with nothing to memorize.
Stages 1–2 — Reversal Extension and Wedge Pop: Signals of a Bottom
① The Reversal Extension is the final acceleration phase of a downtrend. There are three identification criteria on the chart. First, price stretches below the 10/20 EMAs to its widest gap of the entire decline. Second, volume explodes in capitulation-style selling. Third, traces of seller exhaustion appear — long lower wicks, or a full directional reversal within a single day. In Kell's framework, that extreme extension is read, paradoxically, as a clue that the decline may be ending — price looks most hopeless precisely when everyone who was going to sell has sold. But this is an observation stage, not an action stage. Spots that look like the bottom often aren't, and the only thing to confirm here is the extremity of the extension — not the direction.
② The Wedge Pop is the cycle's first transition signal. The identification conditions come in order: after the Reversal Extension low, price has to build a progressively tightening contraction (a wedge) while volume dries up, and then break up through near-term resistance with a close that settles above the 10/20 EMAs. If any of the three is missing — a pop with no prior contraction, or a breakout whose close slips back below the EMAs — the principled call is to not label it a Wedge Pop at all. Traders treat that settled breakout as the first entry candidate, and place invalidation at a break of the wedge low — because if the scenario is right, the wedge low is a level price should never revisit.
Suppose the breakout settles above the wedge at $102 and the wedge low sits at $96. The distance between the candidate entry and the invalidation point is about 5.9%. On a $10,000 account, if you cap a single failure (1R) at 1% — $100 — the position size back-calculates to $100 ÷ 5.9% ≈ roughly $1,700. If the retracement target of the prior decline sits near $114, the reward is +11.8% — a structure of roughly 2R. This calculation doesn't recommend any particular entry; it shows how stage identification translates into a loss-capped structure.
Stages 3–4 — EMA Crossback and Base 'n Break: The Heart of the Trend
③ The EMA Crossback is the stage that tests whether the Wedge Pop was real. After the initial breakout, price pulls back into the 10/20 EMAs, and the question is whether it finds support there and turns higher again. The identification point is role reversal — when the EMAs, which acted as resistance throughout the entire decline, function as support for the first time, the new trend's strength reads as confirmed. Traders watch for support candles near the EMAs (lower wicks, a bounce after volume contraction) as the second entry candidate, and invalidation is a closing break of the EMAs followed by a break of the pullback low. If the pullback cuts through the EMAs and retraces all the way back into the Wedge Pop zone, the framework's rule is to concede that the first signal itself may have been false.
④ The Base 'n Break is the trend's mid-course recharge. Price moves sideways in a consolidation (the base), compressing its range, and when it breaks back through the top of that box (the pivot) on volume, the move is classified as trend continuation. The identification criterion is how 'constructive' the base is — shallow in depth (no more than half the prior advance), volume contracting throughout, and lows holding on or near the 10/20 EMAs. Structurally this speaks the same grammar as Minervini's volatility contraction pattern; the finer rules — contraction counts, shrinking depth — are picked up in the breakout trading and VCP guide.
Invalidation is defined numerically here too. Say price breaks the top of a base at $3,200 and then closes at $3,140 — back inside the box. That's classified as a failed breakout. If the breakout were real, the top of the base should have flipped to support; closing back inside it means everyone who bought the breakout is now underwater. In Kell's framework, the first sign of a trend rolling over isn't a spectacular crash — it's a base that fails to hold.
Stages 5–6 — Exhaustion Extension and Wedge Drop: The End of the Party
Identifying ⑤ the Exhaustion Extension is the mirror image of stage one. This time price stretches above the 10/20 EMAs to its widest gap of the entire trend, volume explodes near the highs, and the slope of the advance goes nearly vertical. Measuring the extension numerically sharpens the call: if pullbacks in the early and middle cycle resolved within roughly ±3–5% of the 20 EMA and price is now floating +16% above it, the trend has reached a statistical extreme by its own standard. In this phase, traders aren't looking for new entry candidates — they're looking at exit plans for what they hold. Signals of momentum fading amid a parade of new highs frequently cross-check with RSI divergence.
By definition, the Exhaustion Extension is the zone where the latest buyer pays the highest price. Chase here on high leverage and even a normal pullback to the EMAs — an entirely expected step from the cycle's point of view — puts you within forced liquidation distance. The purpose of identifying this stage isn't to find a reason to chase; it's to secure the reasons not to.
⑥ The Wedge Drop is the stage where the cycle's door closes. Three identification signals arrive in order: the highs stop extending and start to round over, bounces begin to get rejected at the 10/20 EMAs (support flipping back to resistance), and finally price closes below the EMAs as a downside contraction resolves lower. It's the same structure as the stage-two Wedge Pop with only the direction reversed. Once this classification is made, the framework treats it as invalidation of the entire bullish scenario, and the cycle begins turning back toward stage one. Averaging down and holding on here is a refusal to identify the stage — not a strategy.
The Stage-Identification Procedure — Where Are You Now?
Knowing the six stages and classifying a live chart into one of them are different skills. Below is a learning-oriented reconstruction of how Kell-style identification gets applied to an actual chart. The key is to avoid deciding the conclusion first, and to narrow it down by elimination.
- Lay down the reference lines — put the 10/20 EMAs on the daily chart and mark the swing highs and lows of the past three to six months. Identification always starts from this field of view.
- Measure the direction and size of the extension — is price above or below the EMAs, and is that distance extreme or ordinary relative to this trend's usual pullbacks and bounces? Put a number on it. An extreme extension makes it a stage-one or stage-five candidate.
- Judge the EMAs' role — did the EMAs act as support at the most recent touch (stage three–four territory) or as resistance (stage one or stage six territory)? A spot where the role has just flipped is a transition candidate.
- Check the state of volatility — if price is contracting, the direction of the next break decides the stage. Resolving higher and reclaiming the EMAs is Wedge Pop grammar; resolving lower and losing the EMAs is Wedge Drop grammar.
- Verify with volume — breakouts should come with expanding volume, constructive bases with contracting volume. If volume contradicts the grammar, downgrade your confidence in the classification by one notch.
- Write the invalidation first — once the classification is made, record the level where 'a close beyond this price means my classification is wrong.' The wedge low, the pullback low, a close back inside the base — the fact that each stage puts invalidation somewhere different is this framework's real value.
On a live chart, ambiguous phases straddling two stages are unavoidable. The practical compromise in Kell-style execution is to wait for confirmation — if you're unsure it's a Wedge Pop, wait until the Crossback confirms EMA support; if you're unsure it's a Wedge Drop, watch whether the bounce gets rejected at the EMAs. The cost of receiving one signal late is smaller than the cost of misjudging the stage and entering without invalidation — a conclusion every trend-following grammar shares, and one the trend following guide covers rule by rule.
Applying It to Crypto — Leverage, the 24/7 Market, and This Framework's Limits
Kell's cycle was built on spot equities, on the daily timeframe. Carry it into crypto and three things change. First, crypto trades around the clock, so the time sense of the stock market's 10 and 20 trading days (roughly two weeks and a month) doesn't transplant cleanly, and with no gaps, extensions get worked off through continuous intraday movement. Second, leveraged liquidation mechanics make stage transitions far more violent — when a liquidation cascade attaches to the pullback that carries an Exhaustion Extension into a Wedge Drop, a correction that would take weeks in equities finishes in days. Third, in the thin-liquidity stretches of weekends and off-hours, noise that looks like an EMA breakdown is common, which makes closing-basis confirmation worth even more than it is in stocks.
① Cycle classification is backward-looking. Anyone can divide a finished chart neatly into six stages, but at the live right edge of the chart, a Wedge Pop and a dead-cat bounce — or a base and a distribution top — frequently look identical. ② Labeling involves discretion — two traders can pin different stages on the same chart, and once the rules vary by person, performance becomes a product of discretion, not of the framework. ③ Kell's +941% was a competition result produced with concentrated leverage in the historic 2020 bull market, and there is no independent verification that the same framework produces the same results in other market environments. In directionless, range-bound markets especially, Wedge Pop-type signals fail repeatedly and losses accumulate — the structural weakness of every trend-following grammar of this kind.
So the correct use of this framework is not as a predictor but as a language for locating yourself and designing invalidation. "This classifies as late-cycle, so I mark down the expectancy of any new breakout." "If the Wedge Pop classification is right, that low should never break." Enabling sentences like these is all it does — and that is genuinely useful. What the classification gives you isn't conviction. It's the coordinates of your exit when you're wrong.
The trader who finishes the cycle isn't the one who calls the stage correctly — it's the one who wrote down, in advance, where they'd admit the call was wrong.
The hardest stage to identify in the cycle — stage five, the Exhaustion Extension — is a phase you can cross-check against live measurements on Whale Story. The suspected-top signals detect and flag exhaustion symptoms in coins that have spiked — excessive short-window gains and one-sided trade flow — which overlaps substantially with the observation conditions Kell defined for the Exhaustion Extension: EMA extension plus a volume explosion at the highs. On the live tracker, the large-print trade tape and liquidation feed let you watch the moment chase orders and short liquidations pile up in a vertical stretch and then cut off — the moment the extension runs out of fuel — and the smart-money tracker lets you verify on-chain whether, during the spike, verified smart-money wallets are instead moving size to exchanges — the behavior repeatedly observed at what the classification calls the end of the party. None of these will judge the stage for you, but they add a layer of measured evidence to a classification that otherwise depends on chart shapes alone.
FAQ
Can the Cycle of Price Action be used directly on crypto charts?
The identification grammar itself — EMA extension, role reversal, contraction breaks — is asset-agnostic, but the original was built on spot equities on the daily timeframe. Crypto is a 24/7 market with a different time sense, and leveraged liquidation cascades make stage transitions far faster and deeper. Even using the same framework, invalidation distances and position sizes have to be recalculated for crypto's volatility.
If a Wedge Pop is confirmed, does that mean it's okay to buy?
No. In Kell's framework a Wedge Pop is simply a chart structure classified as the 'first transition signal' — not a buy instruction — and breakouts that fail and break down through the wedge low are common. As in this article's R calculation example, defining the invalidation point and the loss you can absorb comes before any classification, and every decision and its consequences rest with you.
Is the 10/20 EMA setting still daily-timeframe for crypto?
Kell's original uses the daily 10 and 20 EMAs. Some crypto traders apply the same grammar on lower timeframes such as the 4-hour, but the lower you go, the more noise-driven breaks you get and the less reliable the identification becomes. Whichever timeframe you use, fixing one and classifying consistently on it is how you reduce the role of discretion.
What do I do when I can't tell which stage it is?
Not being sure is itself a valid identification result. The practical compromise in Kell-style execution is to wait for the next stage's confirmation signal — EMA support on the Crossback, or the EMA flipping to resistance in a Wedge Drop. The cost of receiving a signal one beat late is smaller than the cost of scaling up exposure without invalidation while misjudging the stage.
Can Kell's results be replicated with this framework alone?
There is no independent verification supporting replication. His +941% was a competition result produced through concentrated position management in the 2020 bull market, and market environment, concentration, and execution were decisive — separate from the framework's identification rules. The accurate way to understand this framework is as a language for defining trend location and invalidation, not as a profit formula.