Day Trading Setups — Condition, Entry, Invalidation, and Target
Published 2026.07.06
Search for 'day trading strategies' and you'll drown in indicator lists and profit screenshots — yet nobody teaches you when to use those techniques and when to walk away from them. What's missing isn't another technique; it's the framework of the setup: a scenario defined in advance that specifies under what conditions you act, where you execute, where you admit you're wrong, and how far you're aiming. This guide first defines the four components of a setup, then breaks down the three structures traders have observed repeating the longest — the range breakout, the trend pullback, and the sweep-and-reclaim reversal — into those four components. It also covers why having a setup doesn't guarantee an edge, and the procedure for turning a setup into a verifiable asset through record-keeping. The conclusion: watching the screen without a setup isn't trading — it's reacting.
- A setup is a pre-defined scenario with all four components filled in: condition, entry, invalidation, and target. If even one is missing, it isn't a setup — it's improvisation.
- The three core setups — the range breakout (a directional resolution at the end of consolidation), the trend pullback (rejoining a trend at its resumption point), and the sweep-and-reclaim (the spot where a push beyond an extreme gets reversed) — each come with a structurally defined invalidation point.
- Invalidation is not an arbitrary stop-loss percentage; it's the price at which the premise of your scenario breaks. Only once invalidation is set does your stop distance exist, and only with a stop distance can you calculate position size and risk-reward.
- A setup's value lies in repeatability, not predictive power. Only by logging the same conditions and building a sample can you separate results from luck — and a setup that stops working is a candidate for the trash bin.
What a Setup Is — The Four Components: Condition, Entry, Invalidation, Target
Sitting in front of a chart and entering on a feeling of 'this looks like it's going up' isn't trading — it's reacting. In trading, a setup is a scenario defined in advance that you execute only when the market meets pre-specified conditions. Day trading means opening and closing positions within a single day, so the number of decisions is high — and the more decisions you make, the more improvisation creeps in. The only device that strips out that improvisation is the setup.
A setup consists of four components. The condition — the market state required for the scenario to activate (e.g., a range whose top and bottom have each been confirmed three or more times). The entry trigger — the specific event that justifies execution once the condition is met (e.g., a candle closing and holding above the range high). The invalidation — the price or structure that confirms the scenario is wrong (e.g., price falling back inside the range). The target — the profit-taking candidates the structure allows (e.g., the range height projected upward). If any one of these is missing, it isn't a setup. In particular, a scenario without invalidation is a scenario with no way to be wrong — and no way to be wrong means no way to be tested.
Before it's a prediction tool, a setup is a unit of record. Only repetition under the same conditions and the same rules lets you aggregate results into statistics, and only statistics let you distinguish whether the approach works from whether you got lucky. A trader who enters for a different reason every time can make 100 trades and still have a sample size of zero.
The four components link together in order. Only once the invalidation point is set does the distance from your entry candidate — your stop distance — exist. Only with a stop distance can you back-solve position size from the amount you're willing to lose on one failed attempt (1R), and compare it against the distance to your target to compute risk-reward. This chain also means every input to the formula covered in Risk-Reward and Expectancy comes out of the setup. Without a setup, a risk-reward calculation is nothing but wishful arithmetic.
Setup 1 — The Range Breakout: A Directional Choice at the End of Consolidation
A sideways range is a zone where buying and selling are in balance, and a breakout is the directional choice made when that balance collapses to one side. Condition: a clearly defined range whose top and bottom have each been confirmed two or three times or more, with swings and volume contracting as the range matures. Entry trigger: a candle closing and holding above the range high, or a retest that confirms the former high acting as support after the break — traders key off a candle body settling above the level, not a wick that merely grazed it. Invalidation: price returning inside the range. The premise of a breakout is 'the balance has broken' — the moment price is back inside the range, that premise no longer exists. Target: the range height projected above the breakout point — the classic measured move, where the size of the consolidation gives the first target of the expansion.
Let's put numbers on it (a learning example, not a recommendation for any specific trade). If ETH held a $3,400–3,500 range for two weeks, the range height is $100, roughly 2.9%. Say you observed the breakout holding around $3,510 and set invalidation at $3,480 — a fall back below the range high. Your risk distance is $30. Set the first target at the measured move of $3,600 and your reward distance is $90 — a 1:3 risk-reward structure calculated before entry. A breakout where this math doesn't work — say, $60 to invalidation but only $60 to the target — gets filtered out as failing the setup's conditions.
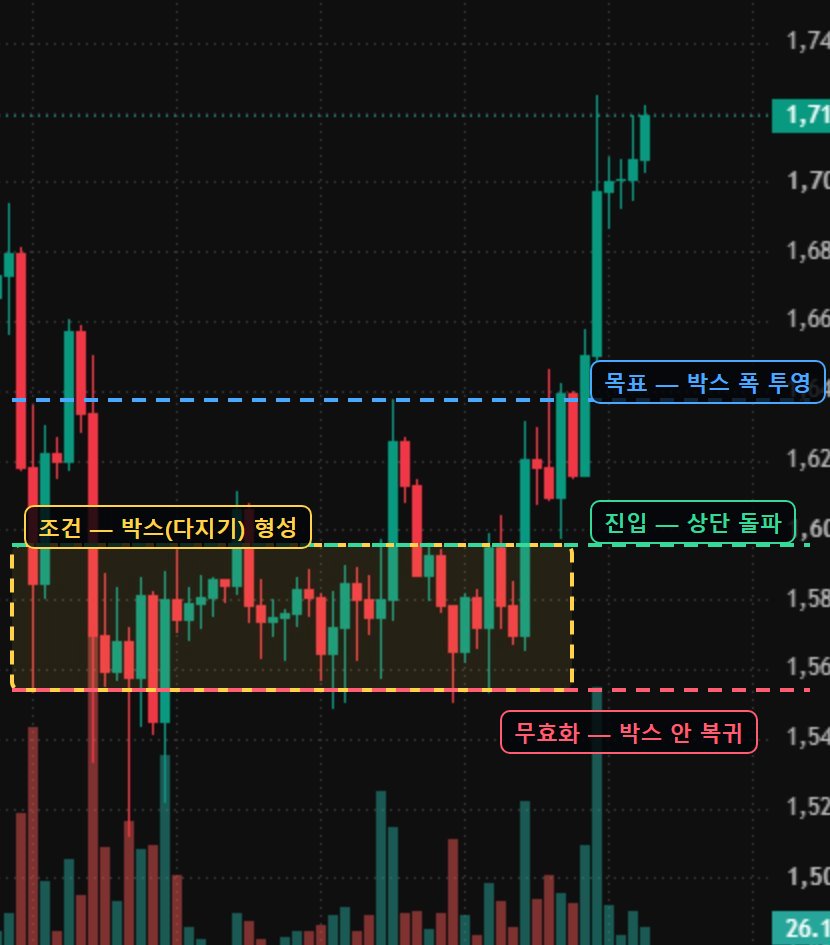
The range breakout's biggest weakness is the fakeout. A large share of breakouts do nothing but fill the resting orders beyond the extreme and then fall back into the range. That's why traders layer on confirmation: did the breakout candle print volume clearly above its recent average, and does the former high hold as support on the pullback? The specific rules for contraction patterns are covered in depth in Breakout Trading and VCP, and the mechanics behind how fakeouts get manufactured in Stop Hunts.
Setup 2 — The Trend Pullback: A Running Horse Catching Its Breath
Trends move in stairs, not straight lines. After an impulse leg higher, chase buying gets exhausted and profit-taking kicks in, producing a pullback — and if the trend is alive, that pullback stays shallow and the move resumes in the trend's direction. The pullback setup positions you at that resumption point in advance. If the breakout setup buys the start of a new move, the pullback setup rejoins an already-proven move at a better price.
Broken into the four components: Condition: an uptrend structure of higher highs and higher lows confirmed on the higher timeframe, with the pullback stalling at 30–50% of the prior leg and overlapping a reference point such as the 20EMA or the prior breakout zone. Entry trigger: a reversal candle in the trend's direction at that spot — a long lower wick, or a reclaim of the prior candle's high. Invalidation: a break of the prior swing low. If the low gives way, the very condition of 'higher highs and higher lows' is broken, and the scenario is over. Target: the prior high first; if the trend continues, fresh-high territory.
A second numerical example. Say SOL ran from $88 to $104 — a $16 leg — and then pulled back. A 50% retracement lands at $96, and the 20EMA happens to pass right through that area. If you watched for a resumption trigger in the $96–97 zone and set invalidation at $94.50, below the prior swing low, your risk distance from a $97 entry is $2.50. The first target — the prior high at $104 — is $7 away, a structure of roughly 1:2.8. At the same spot, if you define invalidation vaguely — 'if a candle loses the EMA' — no stop distance can be calculated, and a stop distance that can't be calculated makes sizing impossible too.
The dividing lines traders watch are depth and speed. If price gives back more than half of the prior leg, or the pullback moves faster than the advance did, they start suspecting it's not a breather but the early stage of a reversal. Judging a pullback setup's condition ultimately comes down to reading higher-timeframe structure — and jumping on a lower-timeframe bounce without that read is the most common way pullback trading fails.
Setup 3 — Sweep and Reclaim: The Spot Where the Trap Just Finished
Stop-loss orders from long positions cluster below the prior low, and stops from shorts cluster above the prior high. In crypto futures, un-cancellable forced liquidation volume stacks on top, making the area beyond an extreme a liquidity pool dense with resting orders. When price stabs briefly through that zone with a wick and then reclaims the level, that move is a sweep — and the sweep-and-reclaim setup looks for structure in the opposite direction at the spot where the trap has just finished doing its work.
The four-component breakdown. Condition: a clearly defined prior extreme with reason to believe stops are clustered there — the more valid the more it's a double bottom confirmed twice or more, or a level that lines up across multiple timeframes. Entry trigger: price that had broken beyond the extreme coming back inside the level and closing there. The key point is that the trigger is the reclaim, not the break itself. Invalidation: a break beyond the sweep wick's extreme — if price that had been reclaimed cracks the wick's tip again, it wasn't a sweep; it was a genuine breakdown. Target: the liquidity on the opposite side — the far extreme of the range, or the prior high. This setup's structural advantage is that invalidation is defined at a narrow, unambiguous point — the wick's tip — keeping the stop distance short. Its structural weakness is that when what looked like a reclaim rolls over into a second breakdown, the stops can print back to back.
The narrative 'smart money hunted my stop' can't be verified — but the fact that stop and liquidation orders stack up beyond extremes, and the fact that volatility amplifies through chain executions when that zone gets tagged, are both observable in the data. The anatomy of the sweep and the checklist for telling real breakouts from fake ones belong to the Stop Hunts guide. This setup simply flips that structure from a defense into a scenario.
Invalidation — Where Do You Admit You're Wrong?
Line up the invalidations of all three setups and a common thread appears. The range breakout: a return inside the range. The pullback: a break of the swing low. The sweep and reclaim: a second break of the wick's extreme. Every one of them is the price at which the scenario's premise breaks — not an arbitrary number like '-3% from entry.' An arbitrary percentage stop sits at a spot unrelated to market structure and gets swept by normal noise, while a structure-based invalidation carries information: 'if this breaks, my thesis is wrong.' If your stops keep getting hit, it's often not that stops are bad — it's that your invalidation is defined outside the structure.
Invalidation is also the starting point of execution. The distance to invalidation is your stop distance, and dividing the amount you'll allow on one failed attempt by that distance gives your position size. In the earlier ETH example, with a risk distance of $30, you set your allowed loss as a fixed fraction of the account and back-solve the size. Sizing up when the stop is tight and sizing down when it's wide — this back-calculation, applied to the same setup, is the practical work that protects an account in day trading. And in leveraged futures, picking the multiplier first without doing this math is itself the root of blowups.
① A setup is only a structure distilled from past observation — it does not guarantee an edge. When the market regime shifts, even a long-working setup goes through stretches where it stops working. ② On a hindsight chart, every setup looks right — in real time, whether the conditions are actually met is far more often ambiguous, and that ambiguity invites discretion, and discretion contaminates your statistics. ③ Tweaking the rules every time results turn bad drifts into overfitting — rules that only fit the past. ④ Paper risk-reward and executed risk-reward are different things — fees, slippage, and missed fills eat away at thin edges, and the shorter the stop distance, the larger the share costs claim. A setup is not a tool that eliminates losses; it's a tool that defines where losses stop.
A setup doesn't promise profits. It only promises where you stop when you're wrong.
Record and Repeat — The Procedure That Turns a Setup Into an Asset
A setup becomes an asset not at the moment you define it, but from the moment records start accumulating. One setup defined narrowly enough to produce statistics beats ten loosely defined techniques. Below is the procedure for turning a setup into a verifiable asset.
- Pick one — choose the one of the three setups that fits your watching hours and temperament, and document its four components in full sentences. Replace vague language ('a strong breakout') with judgeable criteria ('volume at least 2x the average of the prior 20 candles').
- Log every occurrence — record every instance where the condition was met, with screenshots, regardless of whether you took the trade. Logging only the trades you took lets selection bias distort the statistics.
- Record results in R — log outcomes as multiples of your risk distance (+2.1R, -1R), not dollar P&L, so results become comparable across setups and across time periods.
- Don't judge before the sample builds — collect a sample in the dozens before looking at the R total and distribution. Three or four consecutive losses can be an event well within a normal distribution.
- Change rules only per sample block — make one change at a time, after a sample period ends. Rewriting the rules after every trade isn't improvement; it's overfitting.
- Discard what doesn't work — a setup whose R total stays negative over a sufficient sample gets thrown out without sentiment. A setup is not an identity; it's a consumable.
This procedure needs to get stricter as holding times get shorter. In scalping, where the decision count is high, repetition without records leads straight to overtrading. And when you're ready to dig deeper into the breakout family among the three setups, Breakout Trading and VCP — which covers the specific rules of volatility contraction — is your next stop. Doing nothing on days when no setup appears — the fact that this too is an execution that goes in the log is this methodology's final rule.
The 'condition check' for all three setups can be reinforced with observed data on Whale Story. Volume confirmation for range breakouts can be done through the large-trade tape on the live tracker — see for yourself whether real large executions hit the breakout candle, and whether order-book walls vanish without filling (possible spoofing). The 'liquidity beyond the extreme' that conditions the sweep-and-reclaim can be confirmed at whale levels through the actual liquidation-price clustering of top whales, and at the moment you feel the urge to chase a vertical move, the suspected-top signals serve as a reference for observed overheating. Wallet movements on the smart-money tracker show on-chain whether supply is accumulating or draining during a range. All of these, however, are observation tools — past data tendencies do not guarantee the success of any particular setup.
FAQ
How many setups do I need to learn?
At the start, one is enough. A setup's value comes from its sample, not its variety, so building dozens of logged instances with one narrowly defined setup verifies faster than fumbling between three. The usual sequence is to add a second only after the first one's statistics have stabilized.
What do I do on days when no setup's conditions are met?
Doing nothing is that day's execution. A large share of day trading losses come from positions created during setup-less hours out of a feeling that 'I should be doing something.' If you log the non-occurrence of conditions, even the waiting becomes data.
Why does the same setup produce different results every time?
That's normal. A setup is a tool evaluated by the distribution of the whole sample, not by individual outcomes. Good setups pass through losing streaks, and bad setups can string together wins. That's why you judge by the R total over samples in the dozens, and why not rewriting the rules in reaction to individual results is the key discipline.
Are day trading setups different from scalping setups?
The structure is the same; the timeframe and cost sensitivity differ. Scalping uses the same four components on shorter timeframes, but with tighter stops, fees and slippage claim a far larger share. The shorter the holding time, the more rigor is demanded in trigger judgment and record-keeping.