RSI Divergence — Reading the Moment the Speedometer Rolls Over First
Published 2026.07.03 · Updated 2026.07.06
Everyone searching for RSI divergence really wants one thing — a way to start doubting tops and bottoms one beat ahead of everyone else. This piece answers that expectation with methodology. It works through everything in order: the arithmetic of understanding RSI as a speedometer, a 6-step rule set for pairing swing extremes, how to tell the four regular and hidden combinations apart, and where you admit you were wrong (invalidation). It's just as clear about the illusion it strips away — divergence is not a reversal prophecy but circumstantial evidence of exhaustion, and in the face of a strong trend it can be wrong several times in a row.
- Divergence is the phenomenon of price extremes and RSI extremes pointing in opposite directions — the new high arrived as a result, but the force that produced it was weaker than the move before: circumstantial evidence of exhaustion.
- Half of identification is the swing rule. Only recognizing extremes that clear five bars on each side, only comparing pairs within a set spacing — fixing the rules first is what curbs discretion and confirmation bias.
- Regular divergence belongs to the reversal family, hidden to the continuation family — opposite implications. A signal's weight is decided less by the combination itself than by the phase it appears in (the end of an extension vs. a pullback mid-trend).
- Divergence can be invalidated two or three times in a row in a strong trend. Using it alone to fight the trend, without price-side confirmation and an invalidation level, is structurally disadvantaged.
What RSI Really Is — a Speedometer for Price
RSI (Relative Strength Index) is a momentum indicator J. Welles Wilder Jr. introduced in his 1978 book 「New Concepts in Technical Trading Systems」. The computation is simple — take the ratio (RS) of the average gain to the average loss over the last N bars (14 by default), then compress it into a 0–100 range via RSI = 100 − 100/(1+RS). The more the gains dominate the losses, the closer it hugs 100; the more the reverse holds, the closer it hugs 0. In short, what RSI measures is not direction but how one-sided the recent move has been — the speed of price.
The numbers make it intuitive. If the average gain over 14 bars was 1.5% and the average loss 0.5%, RS is 3.0 and RSI is 100 − 100/4 = 75. If price then keeps climbing to a new high, but over that stretch the average gain shrinks to 0.9% while the average loss grows to 0.6%, RS drops to 1.5 and RSI comes down to 60. Price (distance traveled) increased while RSI (speed) decreased — the mismatch that becomes the raw material of divergence comes not from prophecy but from this arithmetic.
Wilder's 70 (overbought) and 30 (oversold) are an observation — 'retracements were frequent in this zone' — not an instruction to sell or buy. Technical analyst Constance Brown, in 「Technical Analysis for the Trading Professional」, documented the tendency for RSI to travel roughly the 40–90 range in a bull market with the 40–50 area acting as support, and roughly the 10–60 range in a bear market with the 50–60 area acting as resistance. In a strong trend, overbought isn't an abnormal state — it's the default state. A high needle on the speedometer means the car is fast, not that it's about to stop.
Divergence — When the New High Loses Its Push
Divergence is the phenomenon of the direction of price extremes and the direction of RSI extremes disagreeing. If price makes a higher high (HH) while the RSI high over the same stretch comes in below the previous one (LH), it means the record arrived as a result — but the force that set the record was no match for the one before it. What Wilder himself singled out in the original book as RSI's single most powerful feature wasn't the overbought/oversold lines; it was this divergence.
① Regular bearish: price HH · RSI LH — evidence the force driving the advance is exhausting. ② Regular bullish: price LL · RSI HL — evidence the selling pressure is exhausting. ③ Hidden bullish: price HL · RSI LL — evidence the uptrend is continuing. ④ Hidden bearish: price LH · RSI HH — evidence the downtrend is continuing. Regular is the reversal family and hidden the continuation family — opposite implications — so memorize the combinations themselves, not the names.
Hidden divergence spread widely through the lineage of Andrew Cardwell, who studied RSI in depth after Wilder. The working distinction is simple — regular is 'a record price strained to produce' (price wins, the indicator loses); hidden is 'a pullback where the indicator is fine but price alone got pushed down' (the indicator wins, price loses). From an intermediate standpoint, what matters more is that the two families are observed in different phases. Regular divergence carries meaning at the tail end of a trend extension; hidden divergence, in pullbacks mid-trend.
The Identification Procedure — Rules for Pairing Swing Extremes
The reason divergence calls differ from trader to trader isn't the indicator's fault — it's the absence of a swing definition. Without a rule for which two highs to connect, you end up 'discovering' whatever divergence you want, anywhere, by nudging your swing selection a little each time. So traders fix the pairing rules first — for example, only recognizing an extreme that stands above (below) the five bars on each side as a swing, and only comparing pairs whose spacing falls roughly between 5 and 60 bars. Comparing two- or three-bar ripples against each other is closer to reading noise than to identification.
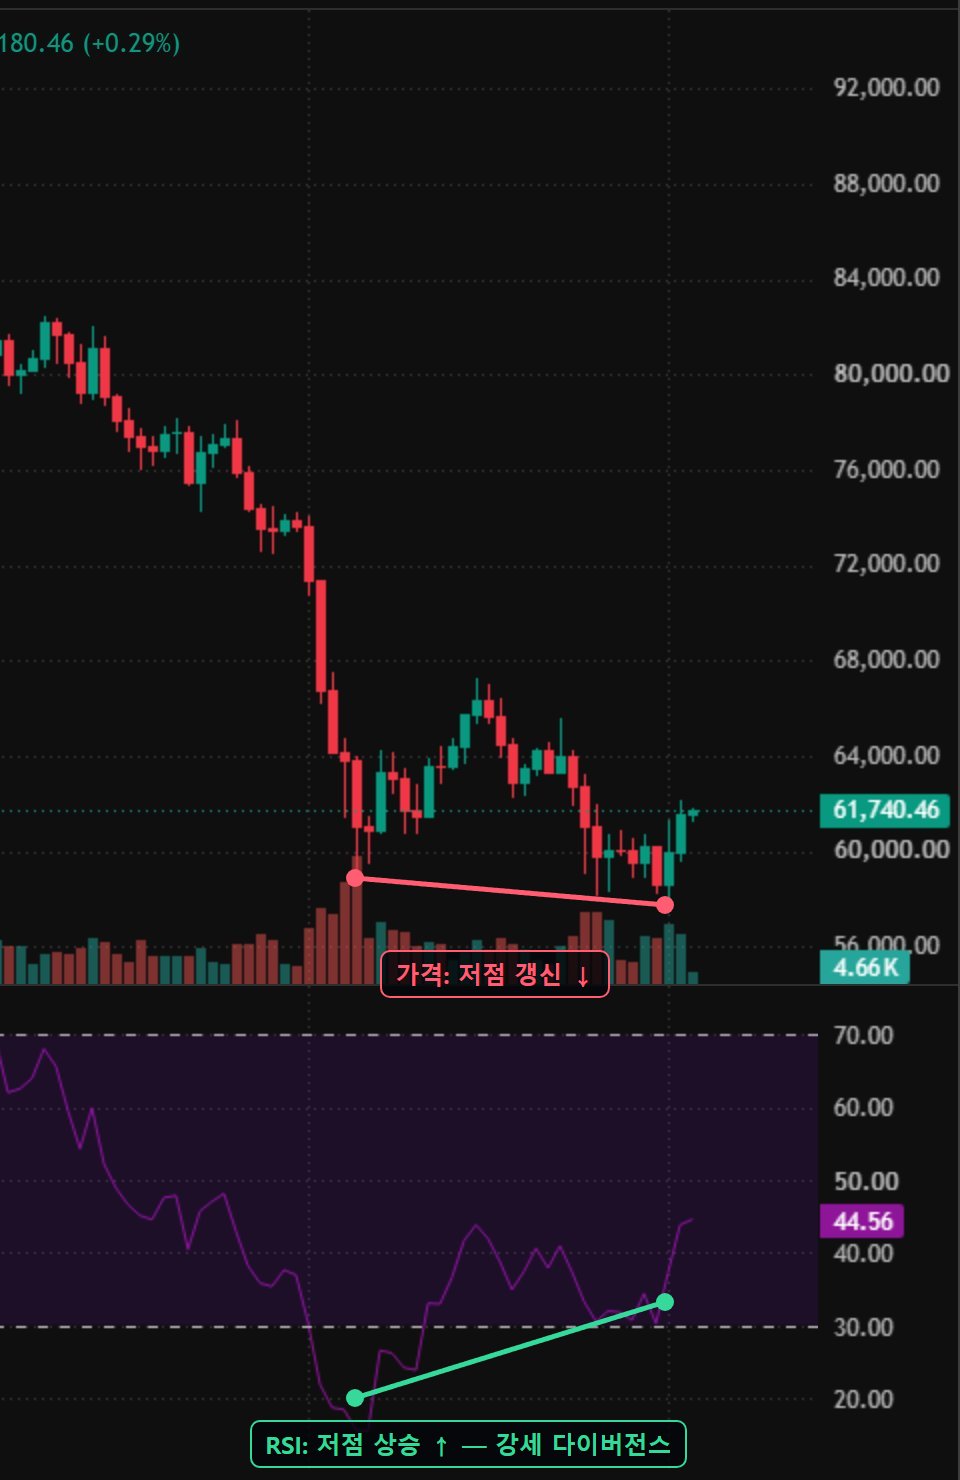
- Fix the swing rule — first define what qualifies for comparison, e.g., only extremes that clear the five bars on each side count as swings. If the rule changes every time, it's not identification — it's wishful thinking.
- Pair the extremes — pick two swing extremes of the same kind (highs with highs, or lows with lows) and discard any pair whose spacing falls outside your set range (e.g., 5–60 bars).
- Compare the RSI extremes over the same span — find the RSI extremes at the same points as the price extremes and check whether the two connecting lines slope in opposite directions. Exclude the in-progress bar and confirm strictly on closed bars — divergence seen before the close can vanish as the bar completes.
- Classify the combination — determine which of the four it is, and if it's regular (the reversal family), state explicitly that it's a signal fighting the current trend.
- Wait for price-side confirmation — don't conclude on the divergence alone; watch whether a change in price follows, such as a break of the prior swing low (high) or a breakdown of trend structure. The indicator presents the context; price does the verifying.
- Define invalidation — if price and RSI renew their extremes together, that divergence is void. Write down in numbers, in advance, where you'll admit you were wrong.
Once invalidation is defined, the size of the risk becomes computable. Take a case on the BTC 4-hour chart: bearish divergence is confirmed at a second swing high of $72,000, and price confirmation (a break of the prior swing low) has followed. Set invalidation about 1% above the high at $72,700 and the first observational target at the prior pullback area of $69,800 (about −3%), and you get $700 of risk against $2,200 of reward — roughly a 1:3 structure. This calculation is not an entry instruction; it's an example of how a divergence gets translated into 'a scenario that defines where it's wrong.'
Reading It Alongside Exhaustion Signals — Divergence at the End of an Extension
The same divergence carries different weight depending on the phase it appears in. The spot traders watch most closely is the exhaustion-style extension — the end of a stretch late in a trend where the slope suddenly steepens toward vertical. Classified as stages 5–6 in the price action cycle, this phase burns through the remaining buying capacity in a short window, so when the mismatch between a new price high and the RSI high overlaps here, the density of the exhaustion evidence goes up.
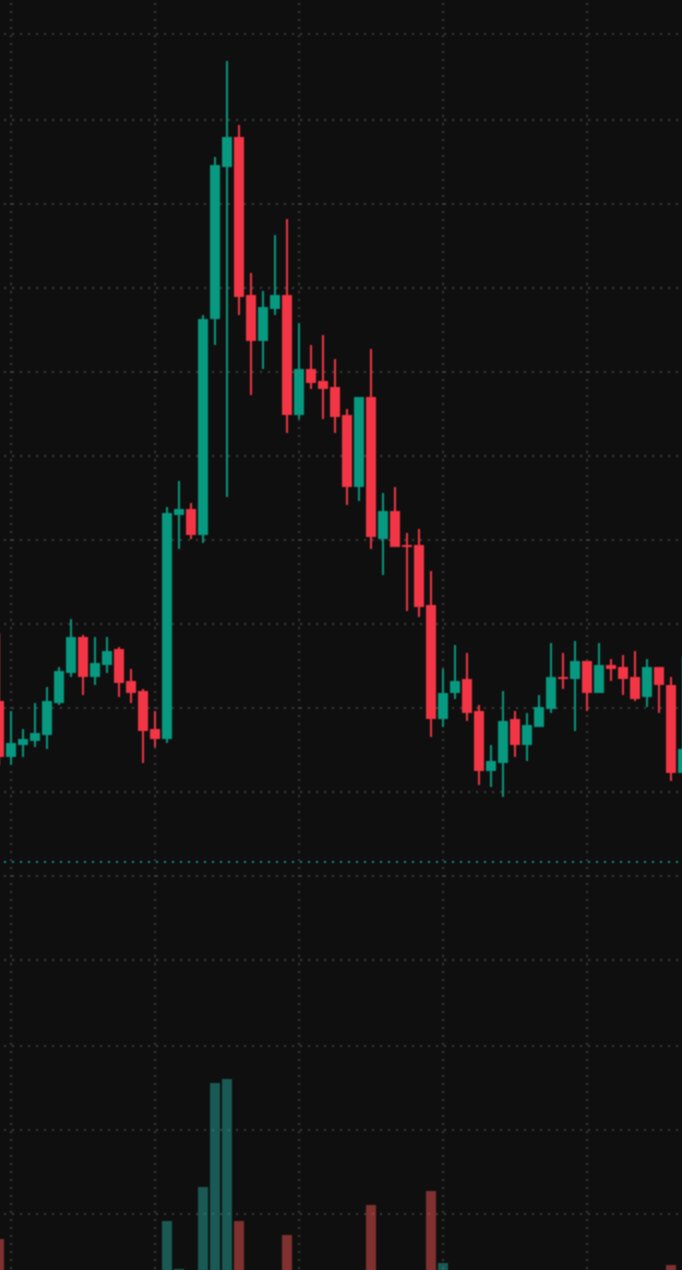
Context gains value as it stacks. Three confirmation signals are commonly set alongside divergence. First, volume — if volume on the stretch that printed the new high is clearly lower than at the prior high, it's evidence participants are stepping away. Second, order flow — if CVD (cumulative volume delta) fails to follow price to the new high, the exhaustion of aggressive buying is confirmed in the trade data as well. Third, derivatives — if funding rates and open interest are skewed toward overheating, it adds evidence that the fuel behind the extension was leverage.
Divergence earns its value not from one indicator line disagreeing, but from the moment several gauges roll over at once.
The Trap — Divergence Doesn't Beat the Trend
The most expensive misunderstanding is reading divergence as a confirmed reversal signal. In a strongly trending market, it's not rare for bearish divergence to appear two, three times in a row while price just keeps climbing. What divergence tells you goes only as far as 'the force isn't what it used to be' — not 'the trend ends here' — and if one dip cools RSI off and the trend reignites, the signal simply dissolves.
① Serial invalidation in a strong trend — keep taking counter-trend shots on divergence alone, and three or four consecutive 1R losses stack up easily. Even with a 1:3 structure, recovering −3R takes one full, clean hit, and the impatience in between breaks your rules first. ② Leveraged counter-trend — fight exhaustion 'evidence' at high leverage, and one more leg of extension ends not in a stop but in liquidation. ③ Overusing low timeframes — on 1- and 5-minute charts, divergence shows up dozens of times a day and mostly ends as noise. The common convention holds that lower-timeframe signals only carry meaning inside the higher-timeframe structure.
The structural limits deserve an honest look too. As long as discretion remains in swing selection, divergence easily becomes an indicator you 'see where you want to see it,' trailed by the confirmation bias of looking uncannily accurate on hindsight charts. There's also a persistent critique that its performance as a standalone signal splits widely by market, period, and swing rule, making consistent independent validation difficult. That's exactly why the whole sequence — fix the identification rules (the 6 steps), stack the confirmation signals (extension, volume, order flow), write invalidation down in numbers — is itself the correct way to use this technique.
Whale Story's Measurements — Cross-Checking Against the Suspected-Top Signal
The 'moment price is rising while the force drains away' that divergence tries to measure is also something Whale Story observes automatically. The Suspected-Top Signal Tracker is a tool that detects and logs the points where signs of overheating and exhaustion overlap as a surge extends. If RSI is a gauge that reads speed from price bars alone, this one asks the same question with measured data — fills and positions. The essential point: it's a detector, not a predictor.
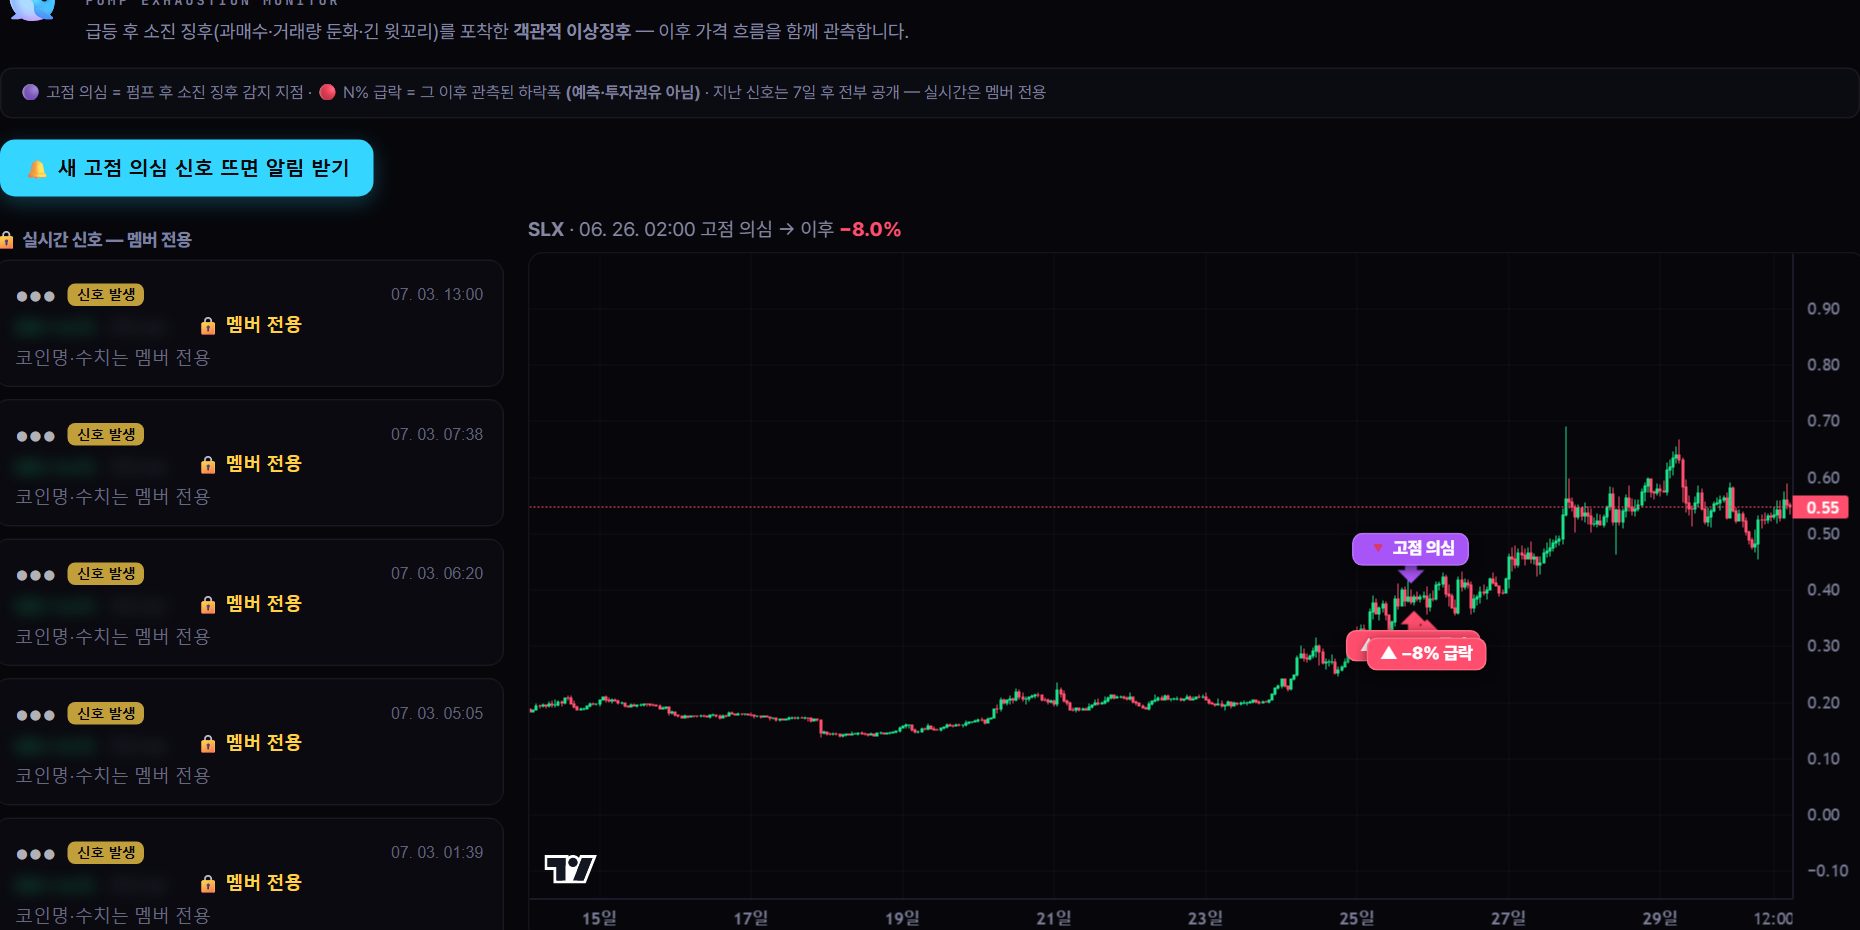
The way to use it as a learning routine is grading. Overlay the divergence zones you found yourself on a past chart — following the 6-step rules — with the moments the signal was actually flagged. Record how much your swing pairing overlapped with the measured exhaustion zones, and which step went wrong in the cases that missed, and you build up self-verification data that neither blindly trusts the indicator nor throws it out. Cross-reference the position changes of large wallets over the same stretch, and context a single indicator could never show comes into view.
🐋 Linking to Whale Story's measurements — the 'exhaustion' that divergence infers from an indicator can be cross-checked at Whale Story against measured data. The suspected-top signal automatically detects and logs the points where signs of overheating and exhaustion overlap as a surge extends, and seven days after each signal fires, the entire set is opened in a free archive so anyone can grade it after the fact. Open the same stretch in the live tracker to see the position changes and large fills of the top whales, and in the smart-money tracker, the actual movements of verified smart-money wallets — checking whether the indicator's disagreement and real money's behavior point in the same direction is what this data is for. It is only a record of past observations and does not recommend any particular trade or entry.
FAQ
Is 14 the 'right' RSI period?
14 is simply the default Wilder proposed in the original book — it's not the right answer. Shorten the period (7–9) and signals come faster at the cost of more noise; lengthen it (21–25) and it slows down, but only the substantial moves remain. Whatever value you use, keeping it consistent alongside your swing rules and verifying it on your own charts matters more than the number itself.
Do swing extremes use the candle's high/low, or the close?
By convention, price swings are read off candle highs and lows, while RSI — being a close-based indicator — is compared at the extremes of the RSI line. That said, in a crypto market with extreme wicks, some traders standardize both on closes. Either way, the key is picking one basis and applying it consistently; change the basis every time and identification itself becomes meaningless.
If regular and hidden divergence conflict across different timeframes, which one should I follow?
A common situation. Many traders take the view that the higher-timeframe signal reflects larger money's movement and follow the convention of prioritizing the higher-timeframe structure. But this too is an interpretive convention, not an absolute rule — and when the two signals collide head-on, holding off on a decision is also a valid choice.
Can I trade on divergence alone?
Not recommended. Divergence is circumstantial evidence that can be invalidated several times in a row in a strong trend, and its standalone performance is known to split widely by market, period, and swing rule. The proper sequence is to set the price-side confirmation signal, the invalidation criterion, and the loss limit first. This article is for educational and informational purposes and does not recommend any specific entry, and every investment decision and its outcome is your own responsibility.