Stop Hunts — The Anatomy of Stop Runs and How to Spot Fake Breakouts
Published 2026.07.06
Every trader knows the feeling: your stop fills, and the price immediately takes off in the direction you originally called. That's why the conspiracy theory — 'smart money is watching my stops' — sells so well. But the phenomenon holds up as a structural outcome even without anyone peering into your account. This guide works through it in order: why stop and liquidation orders pile up just beyond swing extremes, the three-phase anatomy of a stop hunt, a checklist for separating real breakouts from fake ones in real time, how to design stops that sit outside the hunting ground, and the sweep-and-reclaim setup that turns the trap against itself. At the end, we show how to locate the hunting ground in advance — not by guessing, but with the actual measured liquidation prices of top whales.
- Stop hunts emerge from a structure where stop, resting, and forced-liquidation orders cluster just beyond the prior high or low, and once that zone is tagged, chained fills make the move amplify itself. No one's intent needs to be assumed for this to hold.
- The typical sequence runs in three phases — approach (low-volume drift), sweep (piercing the cluster with a burst of fills), and reclaim (re-entering the range after exhaustion) — leaving long wicks and volume spikes as footprints on the chart.
- Real and fake breakouts look identical while they're happening; you weigh candle close location, reclaim speed, volume structure, retest behavior, and open interest changes together to tilt the probabilities. No method identifies them with certainty.
- The standard design puts the stop not just beyond the extreme everyone is watching, but at the structural invalidation point plus a volatility buffer — and absorbs the wider stop distance by cutting position size.
Why Your Stop, of All Stops — Order Clustering Beyond the Extremes
Let's clear up the misconception first. A single retail account's stop order isn't big enough to move the market, and nobody has a reason to single it out. The real problem is that your stop isn't special. Countless traders looking at the same chart see the same low and, by the same logic, park their stops just below it. As a result, the area beyond the prior extreme becomes a place where not individual orders but order clusters accumulate — and the market reacts to the cluster, not to you.
Four kinds of orders stack up beyond the extremes: ① stop-loss sells from longs (below the prior low), ② stop-loss buys from shorts (above the prior high), ③ resting breakout buy and sell orders, and ④ the forced liquidations unique to crypto futures. The first three can be canceled if you change your mind; a liquidation cannot. That makes liquidation clusters the most reliable liquidity on the board — for capital trying to fill large size at favorable prices, they're practically the only spot where opposing orders are guaranteed. This entire logic is also the backbone of SMC trading.
At N× leverage, the liquidation price sits roughly 1/N away from entry. If longs piled in around BTC $60,000, for example, the 20× liquidation prices land near $57,000 (−5%), the 10× near $54,000 (−10%), and the 5× near $48,000 (−20%) — layer upon layer. This staircase of liquidation prices above and below crowded entry zones is the terrain map of the stop hunt. The mechanics are covered in What Is Liquidation.
Anatomy of a Stop Hunt — Approach, Sweep, Reclaim
A typical stop hunt unfolds in three phases. Phase 1, the approach — price drifts toward the cluster on low volume, with no visible tug-of-war between buyers and sellers. The telltale sign is the absence of defensive bids even near support. Phase 2, the sweep — the moment the cluster is tagged, stops and liquidations fill back-to-back as market orders and the move accelerates in an instant. Trade volume explodes and the minute candles suddenly stretch. Phase 3, the reclaim — once the resting orders are exhausted, the fuel in that direction is gone; price returns inside the range, and all that's left on the chart is a long wick.
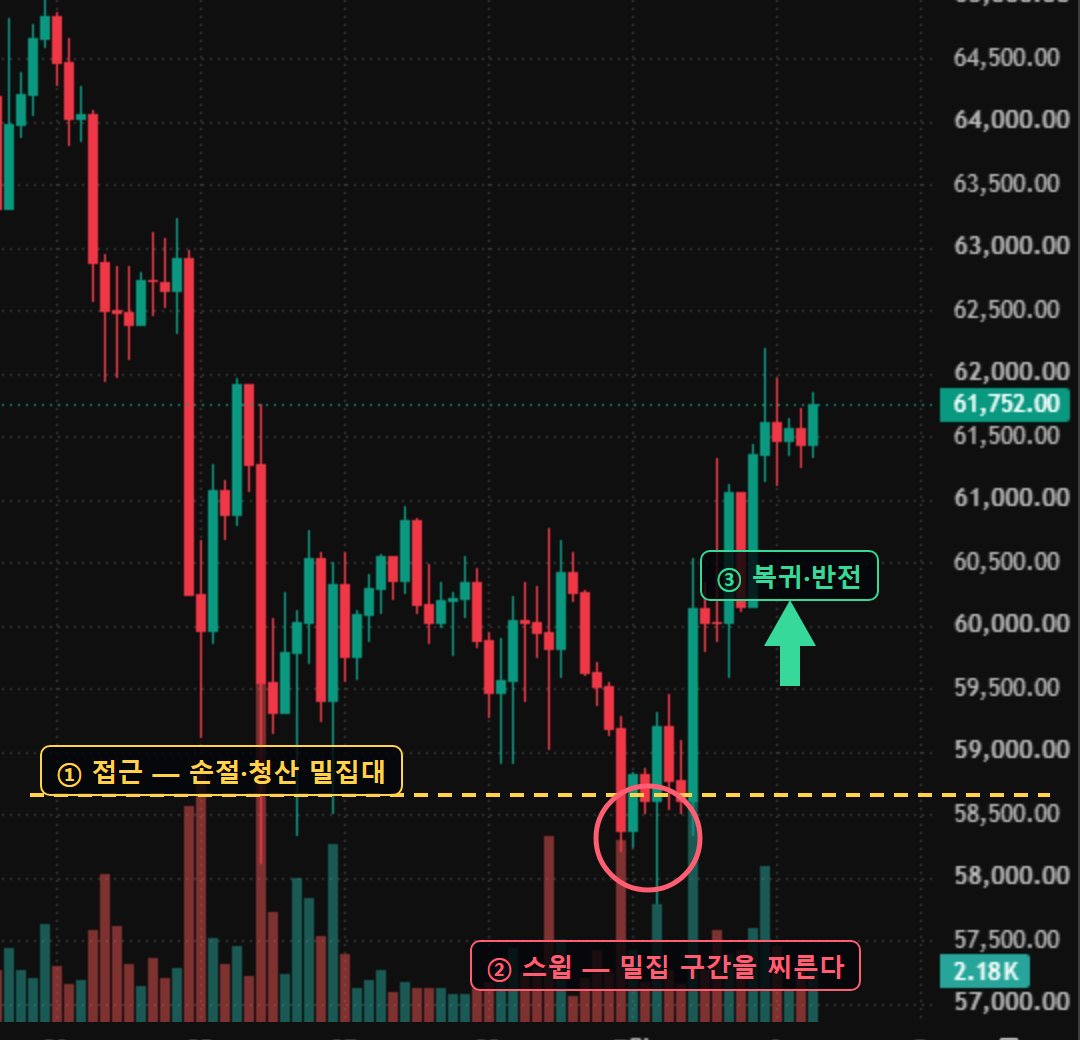
Whether this move was deliberate manipulation by big players or a self-accelerating result of clustered orders getting tagged is impossible to tell from the chart alone. Fortunately, in practice it doesn't matter. Intent is unobservable, but where orders pile up and the footprints a sweep leaves behind are observable — and either way, the trader's response is the same: stop placement design and a post-sweep confirmation process. That is the practical line between the conspiracy theory and the structural view.
What matters in a stop hunt isn't 'who did it' but 'where it happens' — the location can be measured; the intent is forever a guess.
Real Breakout vs. Fakeout — The Verification Checklist
The real reason stop hunts are hard is that, while they're happening, they look exactly like a genuine breakout. Watching the screen at the moment price clears the prior high, you can't tell whether it's the start of a trend extension or a sweep that only collects short stops. So verification isn't a single signal — it's a matter of stacking multiple pieces of evidence to build probability.
- Candle close location — if the candle on your reference timeframe (say, 4-hour) closes with its body settled beyond the level, that's evidence for a breakout; if it closes back inside leaving only a wick, that's evidence for a sweep. Don't judge a break before the candle closes.
- Reclaim speed — a sweep runs out of fuel the moment the resting orders are consumed, so it tends to fall back into the range within a few candles. The longer price holds beyond the level, the more the breakout case builds.
- Volume structure — a breakout keeps printing follow-through fills after the break, while a sweep often shows a single spike at the moment of penetration followed by a sharp drop-off in volume.
- Retest hold — when price pulls back to the broken resistance and that level acts as support (role reversal), that's breakout evidence. The principle is the same S/R flip covered in Support & Resistance.
- Open interest (OI) change — if OI rises with the break, new money is picking a direction; if it collapses, existing positions are being liquidated away. A liquidation-driven break reads as evidence for a likely return into the range.
- Higher-timeframe context — breaks in the direction of the daily trend end as breakouts, and counter-trend breaks end as sweeps, relatively more often — a common observation among traders.
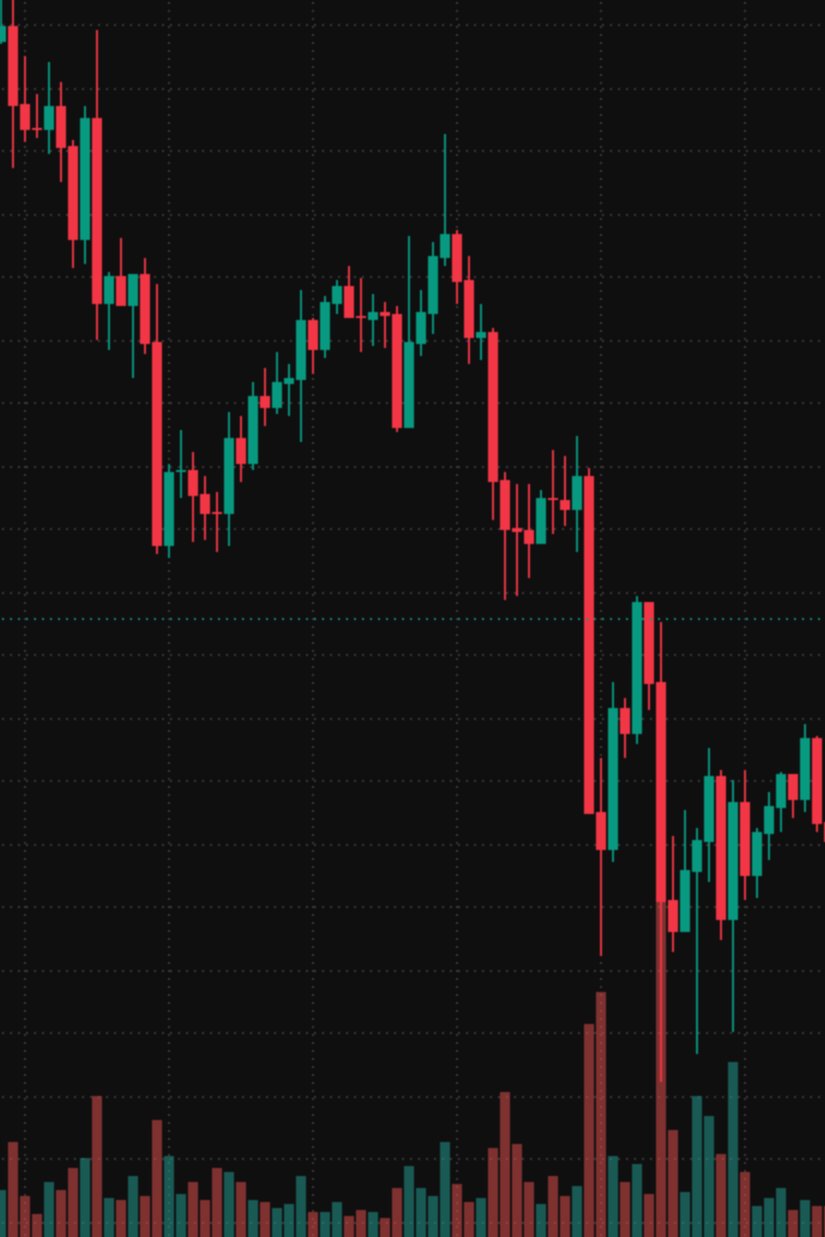
The caveat: this checklist is a scale of probabilities, not a verdict. There are times when all six items point to a breakout and price still comes back — and vice versa. The purpose of the checklist isn't to be right; it's to decide, at the moment of the break, exactly where you'll admit you were wrong.
Where to Put the Stop — Outside the Hunting Ground
Now for the defensive side. The worst place for a stop is just beyond the extreme everyone is watching. With the prior low at $59,200, a stop at $59,150 sits dead center in the blast radius of a routine sweep that pierces the cluster by 0.2–0.5% and comes back. The standard design combines two things. First, place the stop not at a 'price' but at the structural point where your scenario is invalidated. Second, add a volatility buffer to that point — for example, if the 4-hour ATR is $600, add half of it (about $300) and move the stop below $58,900.
The buffer isn't free — you pay for it in size. Say you set your per-trade allowed loss (1R) at 1% of a $10,000 account, or $100, and build a long scenario near $60,000. A stop at $59,150 means a stop distance of about 1.4%, allowing roughly $7,000 notional; add the buffer and drop the stop to $58,900, and the distance widens to about 1.8%, so notional has to shrink to roughly $5,500 to keep the same 1R. In other words, sweep resistance is bought by cutting position size — not by taking on more risk.
Traders burned by stop hunts often land on this conclusion: 'my stops get hunted, so I'll stop setting them.' On a leveraged position, what that choice really does is not delete the stop but surrender control of it — the exchange executes it for you, in full, at a price you didn't choose: the liquidation price. A sweep grazes part of your account; a liquidation takes the entire margin. If the stop distance is more than you can afford at that location, the structurally remaining options are to cut size or skip the setup.
Turning the Trap into a Setup — The Sweep-and-Reclaim Structure
Experienced traders go a step beyond avoiding stop hunts — they flip the sweep itself into a signal. The logic is clean: once a cluster has been swept, the stop and liquidation fuel in that zone is already spent, and where the sellers have sold, resistance in the opposite direction thins out. Broken down into the four elements of a setup: condition — higher-timeframe range low plus confirmed liquidation cluster; trigger — a candle body closing back inside the range after the sweep; invalidation — a renewed break of the sweep low; target — the liquidity on the opposite side (the range high).
Let's run the numbers. With the range low at $59,200, the sweep low at $59,080, and the reclaim confirmation at $59,400, placing invalidation just below the sweep low at $59,050 gives a risk of $350. Taking the first target at the range high of $60,600 gives a reward of $1,200 — a structure of roughly 1:3.4 risk-reward. The point of this math is not a prompt to enter; it's that the invalidation has a clean, unambiguous reference line: the sweep low. If the sweep low breaks again, it wasn't a sweep — it was the first leg of a breakdown, and the scenario is discarded on the spot.
① Calling a sweep is easy in hindsight and ambiguous in real time. Zones where a bounce that looked like a reclaim turns into a second and third sweep, repeatedly burning through invalidations, are common. ② This structure works in ranging markets; in a trending breakdown, the reclaim simply never comes. ③ Which extreme counts as 'the cluster' varies from trader to trader, so reproducibility is low, and no independently verified track record for it has been confirmed. ④ Memory keeps only the sweeps that worked — the clusters that were never touched and the sweeps that collapsed without reclaiming don't get counted, an observation bias that inflates how accurate this technique feels.
In the end, the conclusion of this topic is to hold the verifiable and the unverifiable in separate hands. That orders cluster beyond the extremes, and that fills chain-react when those zones are tagged — that structure is confirmed by data. But the narrative that 'smart money targeted it' and the expectation that 'price reverses after a sweep' are unverified interpretations. Take the structure; don't bet your account on the narrative — that is the place this chapter holds in the advanced track.
Whale Story's Measured Data — Previewing the Hunting Ground on a Liquidation Map
Every argument in this guide converges on a single question — 'where are the orders clustered?' — and chart analysis can only guess at it from the shape of the extremes. If the liquidation heatmap, an estimated density map, is one step better, Whale Story's whale levels are the measured answer: the actual liquidation prices and entry prices of top Hyperliquid whales, overlaid on the chart. The price zones where liquidation prices stack in layers are exactly the hunting grounds this guide has described — and the Qwatio case, where a whale whose liquidation prices were publicly tracked got broken by repeated liquidations on that very map, shows the character of this data well.
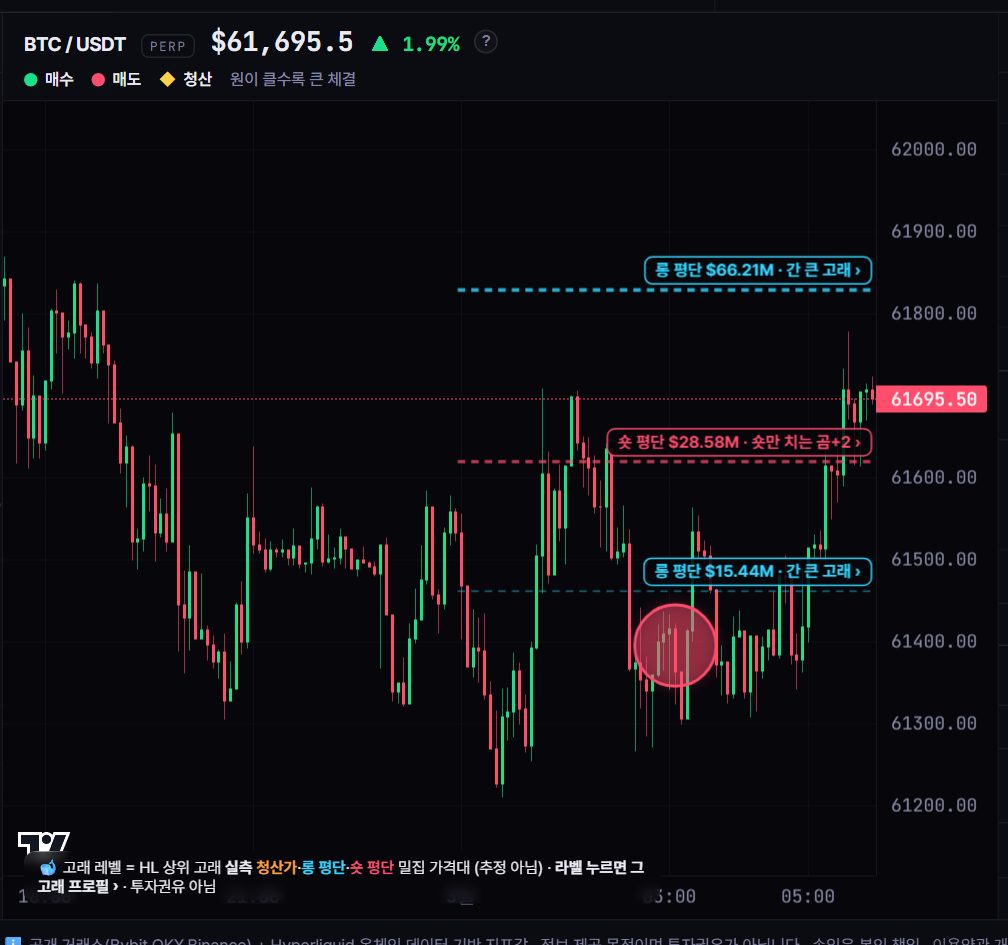
The observation process is simple. Mark a sweep-candidate extreme on your chart, cross-check on the whale levels whether real liquidation prices cluster near it, and as price approaches, watch whether liquidations print back-to-back on the live liquidation feed. An extreme where clustering is confirmed by measurement is a different location from one where it isn't, even if they look the same. That said, this data only shows where the hunting ground is — it guarantees neither when a sweep will occur nor whether price will reclaim, and nothing changes the fact that in leveraged markets no map erases the possibility of loss.
The 'hunting ground' this guide describes can be confirmed on Whale Story by measurement, not guesswork. The whale levels on the live tracker overlay the actual liquidation and entry prices of top Hyperliquid whales onto the chart, and in past observations, price zones dense with liquidation prices have repeatedly played out the same way when a sweep pierced them: chained liquidations printing on the live liquidation feed, leaving a long wick behind. Upward sweeps — surges that collect short stops and liquidations above the prior high — frequently overlap with the exhaustion-type spikes captured by the suspected-top signals, and the smart-money tracker lets you cross-reference on-chain how verified institutional wallets move as price approaches a cluster. That said, this data only shows where orders were stacked and the fact of the fills — it guarantees no reversal or direction at any particular level.
FAQ
Are stop hunts done deliberately by exchanges or smart money?
Verifying intent in any individual case is impossible, and the phenomenon can be explained without assuming intent. Stop and liquidation orders cluster beyond the extremes, and once that zone is tagged, chained fills amplify the move on their own. In practice, the entire response comes down to confirming where the orders are stacked — not who did it.
Is every long wick a stop hunt?
No. Long wicks also form on news, sudden gaps in the order book, and thin overnight liquidity. To read a wick as a stop hunt, you need to confirm that it pierced precisely beyond an extreme where stop and liquidation clustering is suspected, and that fills exploded at the moment of penetration. Judging by shape alone leads to a confirmation bias where every wick looks like a hunt.
Can I avoid stop hunts by setting a very wide stop?
Adding a buffer and widening without limit are different things. The wider the stop distance, the smaller the position must be to keep the same allowed loss, and past a certain point the risk-reward structure itself collapses. The stop belongs outside the sweep's blast radius and at the structural point where the scenario is invalidated — not simply farther and farther away until it stops getting hit.
Is there a way to filter out fake breakouts with certainty?
No. Even stacking candle closes, reclaim speed, volume, retests, and open interest changes, the outcome remains probabilistic. The real value of the checklist isn't prediction — it's that it forces you to define, at the moment of the break, exactly how far price has to go before your read is wrong. Invalidation discipline protects the account more than detection skill does.