James Wynn
How a fully on-chain, extreme-leverage mega-long came apart when the market turned lower — read through the arithmetic of leverage and the mechanics of exposure
Published 2026.07.01 · Updated 2026.07.07
"How can one person lose $100 million?" — that's the real question behind anyone who searches for this case. The answer lies not in bad luck but in structure. On Hyperliquid's on-chain ledger, an anonymous trader known as 'James Wynn' or 'moonpig' made a name for himself with an extreme-leverage Bitcoin long that at one point ran to a notional size in the $1.2B range — and when Bitcoin turned lower, he left behind losses of roughly $100M per public reporting. This piece isn't meant to mock that trajectory or reenact it; it's an exercise in reading two structures that anyone can reproducibly verify on an open ledger — the arithmetic by which leverage compresses the distance to liquidation, and the mechanics by which a large position with a known location becomes a target.
- 'James Wynn (moonpig)' is an anonymous trader known for massive, extreme-leverage longs on Hyperliquid, with his entry price, size, liquidation price, and P&L exposed on-chain in real time.
- During the Bitcoin downturn he became widely known for a loss of roughly $100M per public reporting, and some reports describe him losing over $1M across nine liquidations in the sell-off. All are historical, publicly-reported figures.
- The first structure of a blow-up is arithmetic. The adverse move the account can withstand before liquidation shrinks roughly with the inverse of leverage, so higher leverage erases both the room and the time you can survive on.
- The second structure is exposure. A jumbo position with a public liquidation price becomes a target for liquidity, and the very transparency of the chain comes back as a cost.
Who was moonpig — an extreme-leverage account on an open ledger
'James Wynn' isn't a real name; it's a handle that circulated online, and in the community he was more often called by the nickname 'moonpig.' This anonymous trader repeatedly opened massive, extreme-leverage longs at on-chain derivatives venues like Hyperliquid, and also drew attention with bets on the meme coin PEPE. Because of how on-chain perpetual futures work, anyone with the wallet address can pull up the entry price, size, liquidation price, and unrealized P&L in full. Regardless of his own wishes, his account became a public whale account that the entire market watched in real time.
This case has a clear place in the curriculum. A blow-up doesn't happen by accident; it's created when two structures overlap. The first is the arithmetic of leverage — the higher the leverage, the more mechanically the adverse move allowed before liquidation shrinks. The second is the mechanics of exposure — a jumbo position whose location is public becomes, by itself, a target for the market. Below we pin down the facts first, then take the two structures apart in turn.
No face and no real name, but on-chain a single wallet is a résumé. How to find, track, and read a given wallet is covered as methodology in on-chain whale tracking. This case is a specimen of just how much that methodology can actually reveal.
How the roughly -$100M was made — the facts first
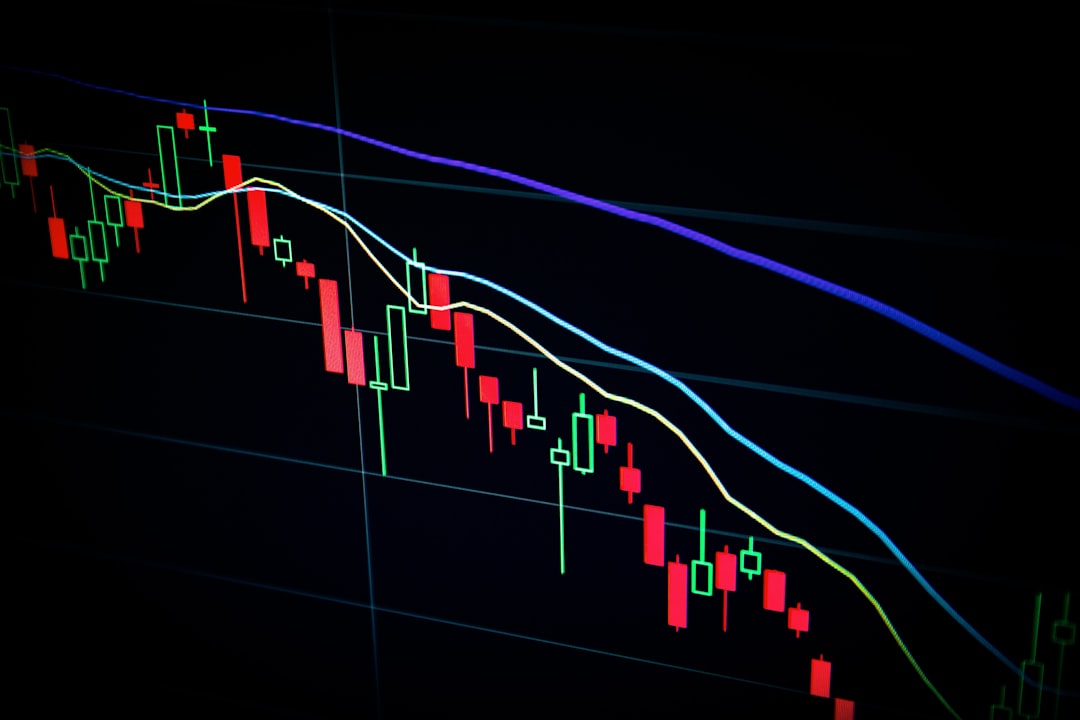
Here is the trajectory the public record confirms. At its peak the account was cited in the hundred-million-dollar range, and the Bitcoin long's notional size was reported to reach the $1.2B range at one point. But when Bitcoin turned lower, the losses ballooned fast, and a loss of roughly $100M — per public reporting from outlets like CoinDesk and The Block — became widely known. Some reports also describe him losing over $1M across nine liquidations in the sell-off (historical, publicly-reported figures). The glamour of the winning stretch and the process of coming apart were both left as records on the same ledger.
The roughly -$100M is a historical figure from public reporting and not a typical outcome. The link between the on-chain wallet and the person likewise rests on attribution inferred by the community and the press. What can be verified is limited to the public wallet record and the reporting, and the premise for reading this case is that this figure is not an example of the money you can 'make' with extreme leverage.
On the other side of a $1.2B long sits exactly $1.2B of downside exposure.
The first structure — the distance to liquidation is the inverse of leverage
The essence of a blow-up isn't luck; it's arithmetic. The adverse move allowed before liquidation shrinks roughly with the inverse of leverage. At 10x it's a little over 10%, and at 40x the margin is used up on an adverse move of not even 2.5% — and once you subtract maintenance margin and fees, the actual cushion is thinner still. On top of this, an enormous notional size creates a cost of carry — the bigger the position, the heavier the funding rate and open interest burden and the fill slippage, so even 'holding on' isn't free. The procedure for calculating leverage, margin, and liquidation price is covered in the leverage lesson.
- Open a large position at extreme leverage — the liquidation price sits within a few percent of the entry
- In a favorable stretch, exposure and conviction grow along with the paper gains — there seems to be no reason to trim size
- Even when the direction turns, with no invalidation level set in advance the position is held — the thin cushion is burned through in a single leg down
- Responding by adding margin or white-knuckling it, you hit forced liquidation — a long-built track record is erased in one stroke
High leverage doesn't only magnify the gains when the direction is right; it also compresses the room and the time the account can withstand. A single fleeting shake can force-liquidate the entire position, and that mechanism is explained step by step in why you get liquidated. This is an explanation of the risk structure, not a recommendation of any particular leverage or entry.
The second structure — a position whose location is public becomes a target
In on-chain perpetual futures, the liquidation price of a large position is effectively public information. A known liquidation price has forced-sell volume booked at it, and the market treats that point as a pool where liquidity has collected. Why the pattern of price drifting as if drawn toward large liquidation lines is repeatedly observed is covered as structure in the liquidation heatmap lesson. Even when you're anonymous, if the position is transparent, that transparency itself becomes a cost.
The mismatch between the tool and the holding period is also worth flagging. Extreme leverage, with its narrow tolerance for adverse moves, is closer to the grammar of scalping, which by nature cuts exposure time into minutes. Apply that leverage to a directional swing of hundreds of millions to billions in notional, with no stated invalidation level, and you get the contradiction of 'holding, for a long time, a position that can't survive even a small shake.' What is observed in this case is precisely that contradiction.
What to take from this case — and the limits of verification
A public whale account is observational material for learning, not something to replicate. A big account doesn't mean big skill, and size actually creates the headwinds of exposure, cost, and targeting — which is why this case is cited as a representative counterexample in the whale playbook. Whale Story's live tracker still shows the average-entry and liquidation-price levels of top whales as measured data — not a signal to follow, but a tool for confirming with your own eyes, in real data, the two structures this article has described.
At the same time, there are limits to interpreting this case. All we know is the wallet record and the reporting; the trader's full assets, hedges, and intent are unknowable. A flat verdict of 'reckless gambling' and a reading of 'calculated promotion' are equally impossible to verify. So this article avoids judging the person and leaves only the two reproducibly verifiable structures — the arithmetic of leverage and the mechanics of exposure — as the lesson.
Someone else's leverage, size, and timing are different from your own capital, time, and psychology. The very impulse to scale up size after seeing only the glamorous stretches of a public account is a representative trap covered in trading psychology.
The lesson of this case boils down to two lines. The higher the leverage, the more the room and the time the account can withstand shrink together (leverage and the structure of liquidation), and a large position whose location is public becomes, by itself, a target for the market (liquidation heatmap). More important than the number roughly -$100M is that the outcome is less an exceptional stroke of bad luck than the mechanical consequence of those two structures. The procedure for designing losses down to a size the account can bear, in advance, is covered in risk management — and this case is a record left permanently on-chain of what happens when that procedure is absent.
FAQ
Are James Wynn and moonpig the same person?
Both are a name and a nickname used online, and they refer to the same anonymous trader. His face and real name were never made public, and the link between the wallet and the person rests on attribution inferred by the community and the press. This article is an educational case analysis built on public on-chain and news records, with no intent to identify or defame any individual.
Did he really lose around $100M?
During the Bitcoin downturn, a loss of roughly $100M became widely known based on public reporting and on-chain data, and some reports also describe him losing over $1M across nine liquidations in the sell-off. That said, these are historical, publicly-reported figures and not a typical outcome. It's a specific case of extreme leverage — it doesn't mean everyone experiences P&L of the same scale.
Why is extreme leverage so dangerous?
Because the adverse move allowed before liquidation shrinks roughly with the inverse of leverage. At 40x, for example, the margin is used up on an adverse move of not even 2.5%, and once you subtract maintenance margin and fees the actual cushion is thinner still. The detailed principle is covered in the leverage lesson and the 'why you get liquidated' lesson, and this is an explanation of the risk structure, not a trading recommendation.
What happens when a large position's liquidation price is public?
A known liquidation price has forced-sell volume booked at it, so a structure forms in which the market treats that point as a liquidity target. That's why the pattern of price drifting as if drawn toward large liquidation lines is repeatedly observed, and the liquidation heatmap lesson explains this dynamic as structure.