SMC Trading Dissected — Selection Rules for Order Blocks, Liquidity Sweeps, FVG & BOS/CHoCH
Published 2026.07.03 · Updated 2026.07.06
"Smart money only moves in its real direction after sweeping out retail stops" — that's the sentence that sends people searching for SMC (Smart Money Concepts) trading. Instead of selling that narrative, this piece teaches the method. We dissect, as a chart procedure, the rules for designating order block and FVG candidates, the order in which liquidity sweeps and BOS/CHoCH get assembled, and where you admit the scenario is wrong. At the end, we cover how to cross-check the liquidity locations SMC merely guesses at against the measured liquidation prices of top whales. And we don't hide the reproducibility debate that trails this method either.
- SMC is a system that deduces liquidity, sweeps, order blocks, FVG, and BOS/CHoCH from a single assumption: big capital can only get filled where opposing orders are piled up.
- The backbone of identification is rules. A sweep is confirmed by three conditions — wick-only breach, close back inside, and a burst of fills — while order blocks are narrowed down by filters: accompanied by displacement, untouched, and formed right after a sweep.
- The order of application is sweep → CHoCH → order block/FVG retracement, and the real value of this method is defining the invalidation point (a close beyond the far side of the block) before any entry is even considered.
- Critics persistently argue the rules are loose enough that everything looks correct in hindsight, and the guesswork about where liquidity sits can be cross-checked against measured liquidation-price data from top whales.
The Skeleton of SMC — Big Capital Needs the Other Side of the Trade
SMC (Smart Money Concepts) grew out of a framework that forex trader Michael J. Huddleston taught for years under the name ICT (Inner Circle Trader), and it spread to retail traders worldwide after he released a free mentorship series on YouTube in 2022. The roots aren't new. The lens of imagining the market as a single big player and reading along with its intent was laid out a century ago by Wyckoff; SMC is closer to a derivative system that translates that lens into the language of modern derivatives markets — stops, liquidations, and resting orders.
The entire system stands on one assumption. A buyer trying to acquire $100 million worth has to get matched against the same amount of sell-side size, so it can't build a position at just any price. The place where opposing orders are stacked thickest — where stops and forced liquidations cluster — is nearly the only place big capital can process its size, and therefore price moves toward that place. From this assumption, every tool — liquidity, sweeps, order blocks, FVG, BOS/CHoCH — is deduced. This piece dissects those tools in the order of 'how to identify them on a chart, how to assemble them, and where to admit you're wrong.'
Price moves from liquidity to liquidity — the sentence SMC repeats like a first principle, and the claim this entire piece puts to the test.
Drawing the Liquidity Map — Where Stops and Liquidations Pile Up
In SMC, liquidity means clusters of unfilled orders resting at specific price levels. They tend to pile up in three places. First, just outside the prior swing high/low — stop-loss sells from longs cluster below the prior low, stop-loss buys from shorts above the prior high. Second, around round numbers like $60,000. Third, the pillar unique to crypto futures: forced liquidation. The liquidation price of N× leverage sits roughly 1/N away from the entry (an approximation that ignores maintenance margin), so liquidation size stacks like a ladder above and below the price zones where entries clustered. Stop orders can be canceled, but a liquidation can't — which is why liquidation clusters are considered the most reliable form of liquidity. The mechanics are covered in What Is Liquidation?.
- Mark higher-timeframe structure — mark swing highs and lows on the 4H and daily. Ignore the lower-timeframe ripples at this stage.
- Flag stop-cluster candidates — draw horizontal boxes just outside prior extremes, double tops/bottoms, and support/resistance areas that have been defended multiple times. Draw them as zones, not lines.
- Add round numbers — overlay psychologically sticky prices (e.g., BTC $60,000 and $65,000).
- Back-calculate the liquidation ladder — from the entry zone where volume piled up, compute and mark the 25× (±4%), 10× (±10%), and 5× (±20%) liquidation prices.
- Assign priority — treat zones where stops, round numbers, and the liquidation ladder overlap as the thickest liquidity pools, and only move to the next step (watching for a sweep) when price approaches them.
Say BTC has built heavy volume around $63,000. The 10× long liquidation price for that zone sits roughly at 63,000×0.9 = $56,700, and the 20× at 63,000×0.95 = $59,850 (approximations ignoring maintenance margin). If the prior swing low is $62,400, stop-loss sells cluster just below it, and the round number $62,000 overlaps. The result: the $62,000–62,400 band and the areas around $59,850 and $56,700 become the liquidity candidates on the map. This calculation is a hypothetical to illustrate the structure, not a basis for trading any particular price.
Spotting the Liquidity Hunt — Anatomy of a Sweep
A liquidity hunt (sweep, stop hunt) is a move where price briefly pokes into a dense zone marked on the map, fills the resting orders, and comes back. The identification conditions compress to three. First, the breach of the extreme is left as a wick, not a closing body. Second, within 1–3 candles of the breach, price returns and closes back inside the level. Third, volume and liquidation fills spike at the moment of the poke — hard evidence that resting orders were actually swept. If the close-back-inside condition is missing, your first suspicion should be a breakout in progress, not a sweep. The structure of how stop hunts get engineered is dissected separately in the stop hunt guide.
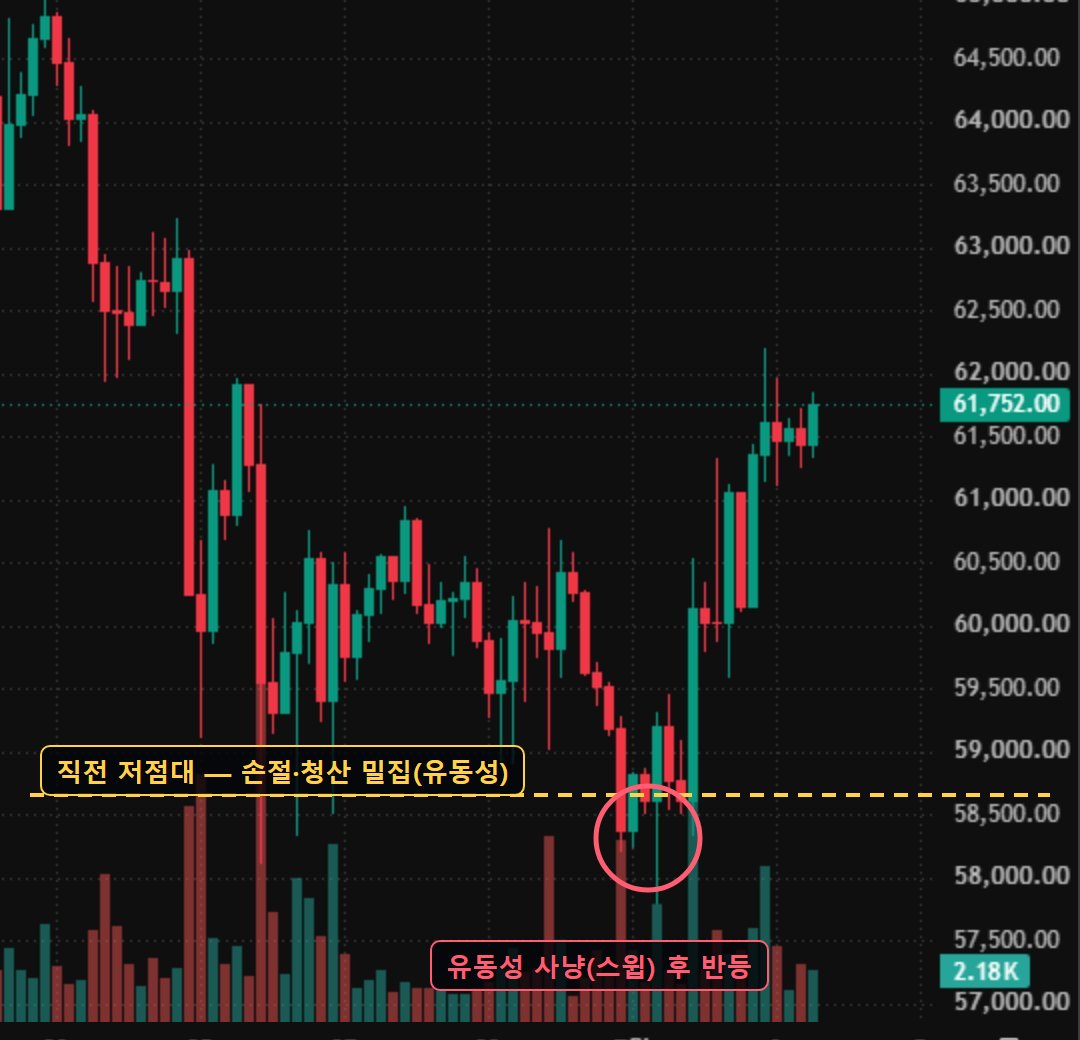
The sweep-or-breakout call is made on the close of the timeframe you drew the level on. If the low was drawn on the 4H chart, you check whether the 4H candle closes back inside the level. The moment you drop to the 15-minute chart to insist 'it's still a sweep' when the call goes against you, the rule turns into wishful thinking.
Order Blocks and FVG — Candidate Rules and Confirmation Steps
An order block is the zone of the last opposite-direction candle (or cluster) right before a sharp change in direction. The last down candle before a strong rally is called a bullish order block; the last up candle before a sharp drop, a bearish order block. On that definition alone, half the chart qualifies — so practical SMC layers three filters on top. First, the move after the block must be strong enough to break the prior structure (displacement — accompanied by the BOS covered in the next section). Second, only untouched blocks that price hasn't yet returned to remain valid candidates. A block that's been pierced deep once is considered spent. Third, blocks formed right after a liquidity sweep get higher priority.
An FVG (Fair Value Gap) is the empty zone that forms across three consecutive candles when the high of the first and the low of the third don't overlap (for an up move; reversed for a down move). It's read as the footprint of an imbalance where a rushed move filled only one side's orders, and SMC holds that price tends to return and fill the gap. In practice, zones where an FVG overlaps an order block are treated as higher-priority candidates. That said, in strong trends, gaps that never get filled are common.
Let's put invalidation and the risk-reward structure into numbers (a hypothetical calculation for learning purposes). Say a bullish order block prints at $2,410–2,440 on the ETH 4H chart, and the invalidation rule is set as 'a close below the bottom of the block.' Taking a retracement touch of the block's top at $2,440 as the hypothetical entry and placing the stop slightly below the bottom at $2,398, the risk is $42 (about 1.7%). Targeting the prior swing high at $2,566 makes the reward $126 — a 1:3 risk-reward structure. The point isn't prediction: it's that the block defines the invalidation level and stop distance before the entry is even considered.
BOS and CHoCH — Reading Structure Shifts
The raw material for reading structure is swing points. Mark the highs that stand above their neighboring candles and the lows that sit below them, and the market simplifies into a sequence of highs and lows. A BOS (Break of Structure) is a new extreme in the direction of the trend — in an uptrend, a close above the prior high — read as confirmation of trend continuation. A CHoCH (Change of Character) is the opposite: the first moment structure breaks against the trend. In an uptrend, a prior swing low giving way on a closing basis is the first reversal warning. Judging both by closes rather than wicks is the minimum safeguard against hindsight reinterpretation.
- Judge the trend — on the 4H/daily, a string of BOS reads as trend continuation; a CHoCH gets classified as a reversal alert.
- Map the liquidity — use the procedure from section 2 to pre-mark liquidity candidates beyond the extremes.
- Watch for the sweep — when price touches a candidate zone, check the three conditions (wick-only breach, close back inside, burst of fills).
- Confirm on the lower timeframe — right after the sweep, watch whether a CHoCH prints on roughly the 15-minute chart. A CHoCH without a sweep, or a sweep without a CHoCH, gets demoted to a half signal.
- Record the zone and invalidation — mark the order block/FVG at the reversal origin as the retracement watch zone, and write down the invalidation (a close beyond the far side of the block) first.
- Review — whether the scenario worked or failed, record which link in the chain broke, building your own verification data.
The order is the whole point. Grabbing a later link while an earlier link in the sweep → CHoCH → retracement chain is missing — calling some down candle an order block when there wasn't even a sweep — is exactly where this method turns to mush. And whatever the scenario, once invalidation is confirmed on a close, you scrap it on the spot. On a leveraged account, 'let's just watch a little longer' is the shortest path to forced liquidation.
The Reproducibility Debate — Everything Looks Right in Hindsight
Now for the honest part. On a hindsight chart, SMC is always right. Every down candle before a bounce looks like an order block, every empty zone looks like an FVG, every long wick looks like a sweep. But apply the same rules forward from the right edge of the chart and the candidates balloon into dozens — and which one works can only be known after the fact. The looser the rules, the higher the hindsight hit rate and the blurrier the forward predictive power — that's the core of the confirmation-bias criticism that trails SMC.
① A strong trending market — price leaves without ever giving the order block/FVG retracement. The level you were waiting for may never come. ② A move you read as a sweep turns into a genuine breakout — the reversal scenario becomes a straight loss. ③ Discretion in the identification rules — if different traders draw different blocks on the same chart, what decides success or failure is the person's discretion, not the method.
More fundamentally, critics persistently note that SMC's rules aren't mathematically closed, which makes independent backtesting difficult, and that no publicly verified long-term performance record has been confirmed. The live-trading results of ICT himself, the founder, have faced ongoing verification controversy as well. 'Smart money's intent' can't be observed, so it can be neither verified nor falsified. Even so, it's not all worth discarding. That stops and liquidations pile up beyond the extremes, and that volatility gets amplified through cascading fills once that zone is touched, is observable structure, not narrative. One question remains — instead of guessing 'where' that liquidity sits from chart shapes, is there a way to measure it?
Measured on Whale Story — a Map of Real Liquidation Prices, Not Guesses
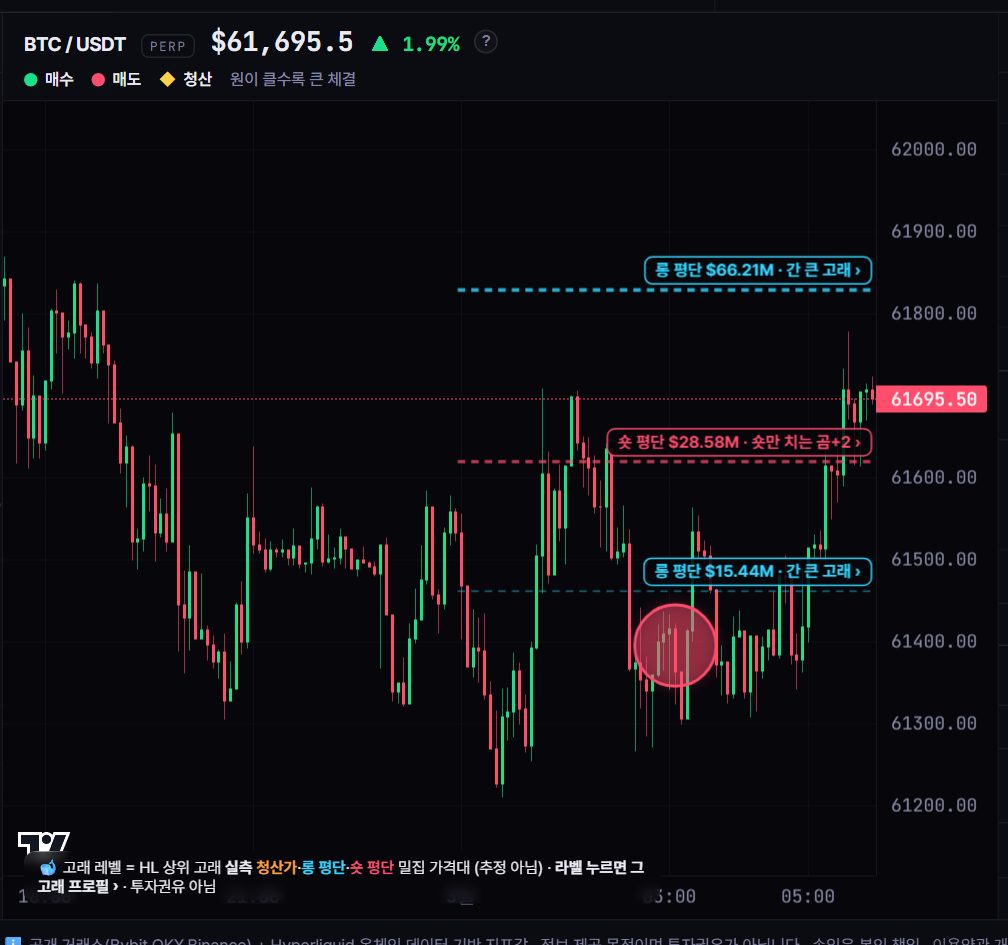
The Whale Levels on Whale Story's live tracker overlay the actual average entries and liquidation prices of top Hyperliquid whales onto the chart. That means the liquidity pool SMC guesses 'should be piled up around here' can be cross-checked against a measured value: the price bands where real liquidation prices stack layer on layer. Hyperliquid makes this comparison possible because positions are public on-chain (What Is Hyperliquid?). Put the liquidation heatmap — an estimated density map — next to the measured levels, and you can grade your evidence by reliability: chart guess → estimated map → measured value.
The observation routine is simple. After drawing your liquidity map, cross-check whether real whale liquidation prices actually cluster in your candidate zones, and record whether liquidation fills actually print in succession on the feed as price approaches. If nothing happened in the zones you marked, the map was wrong — and that record itself becomes the data with which you verify SMC with your own hands. In every case, these tools are raw material for detection and observation; they don't pick a direction. The choice of direction and the bearing of losses always belong to the account's owner.
The liquidity pools SMC guesses at can be cross-checked with measured data on Whale Story. The Whale Levels on the live tracker overlay the actual liquidation prices and average entries of top Hyperliquid whales onto the chart, and in past observations, whenever price poked into these dense zones, liquidation fills clustered on the tape and a long wick was left behind — a scene that repeated again and again. For reading overheating in sharp run-ups there are the suspected-top signals, and for turning the 'smart money accumulation' narrative into the measured reality of on-chain wallet movements there's the smart-money tracker. All of these are detection and observation tools; none of them guarantees a reversal or a direction at any given zone.
FAQ
How is an order block different from classic support/resistance?
There's a lot of overlap. An order block is the concrete candidate rule 'the last opposite-direction candle right before a sharp reversal' with filters layered on top, like displacement and being untouched. In practice, many view it as just one of several ways to pick support/resistance zones, and the essence is closer to 'are there actually resting orders left in that zone?' than to the label itself.
Does an FVG always get filled?
No. SMC traders hold that gaps tend to get filled, but in a strong trend, gaps that go unfilled for a long time — sometimes forever — are common. It's also worth knowing that 'it fills eventually' is a statement that's hard to verify unless it specifies a timeframe.
What timeframe do you draw order blocks and levels on?
The standard teaching is to set structure and liquidity levels on higher timeframes like the 4H and daily, then confirm sweeps and CHoCH on lower timeframes around the 15-minute. What matters is fixing the judging timeframe in advance. Once you start switching timeframes to reinterpret a call that's going against you, the invalidation rule becomes meaningless.
Is there evidence that SMC actually produces profit?
No independently verified public performance record has been confirmed. The structure itself — stop and liquidation orders clustering in specific zones — is observable in data, but the rules for turning that into P&L vary from person to person, making it hard to measure the method's performance in isolation. Many argue the outcome hinges mostly on risk management and consistency of execution.