Breakout Trading and VCP — Measure the Contraction, Draw the Pivot, Define Invalidation First
Published 2026.07.03 · Updated 2026.07.06
Anyone searching for breakout trading wants one thing — the eye to recognize the spot that's about to explode. But in this technique, what you need before the eye is a ruler: one that measures the depth of each contraction, one that measures the distance to the pivot, one that measures where you exit when you're wrong. This piece breaks Minervini's VCP (Volatility Contraction Pattern) down into measurable rules, then walks through entry design procedure, false-breakout filters, and invalidation criteria in order. It doesn't hide the uncomfortable fact that a large share of breakouts get reversed — it's written from the view that cutting those failures small is the whole technique. This is educational material dissecting a structure, not a recommendation for any specific trade.
- The battle in breakout trading is decided not at the moment the boundary breaks, but in the contraction process before it. A breakout without a confirmed contraction isn't even a candidate for this technique.
- VCP boils down to three measurable rules — 2–4 pullbacks, each pullback's depth shrinking to roughly half of the prior one, and volume drying up with each contraction until it hits its lowest right before the breakout.
- The pivot (the high of the final contraction) is a line you draw before the breakout. Stop distance, position size, and target are all back-calculated from this line — breakout trading without a pivot isn't design, it's chasing.
- False breakouts aren't the exception; they're a statistical fact of life. Filter them with missing volume, a close that fails to hold, a base without contraction, and a failed retest — but define your invalidation point first, on the assumption you'll still be wrong sometimes.
The Logic of Breakout Trading — The Longer the Base, the Bigger the Release
Breakout trading targets the phase where a price balanced between support and resistance breaks its boundary. The logic runs two layers deep. First, the longer a range persists, the more it accumulates trapped positions, break-even psychology, and stop and pending orders sitting just outside the boundary. The moment the boundary breaks, those waiting orders fire in one direction all at once, and the move amplifies itself. Second, volatility cycles. Volatility that has contracted tightly eventually resolves into expansion, and across many markets it has been observed that the longer and firmer the contraction, the larger the amplitude of the release tends to be.
The lineage is a repetition of this same observation. In the 1950s, Nicolas Darvas laid out his 'box theory' — the observation that a rising stock climbs by stacking price boxes one on top of another — William O'Neil refined the buy-pivot concept, and Mark Minervini, after winning the 1997 U.S. Investing Championship (a 155% annual return), consolidated it all under the name VCP (Volatility Contraction Pattern). Where this spot falls within an uptrend's cycle overlaps exactly with the base-and-break stage of Kell's price action cycle.
A breakout is a process, not an event — it's the contraction beforehand, not the moment of the break, that determines a breakout's quality.
VCP — The Concrete Rules of the Volatility Contraction Pattern
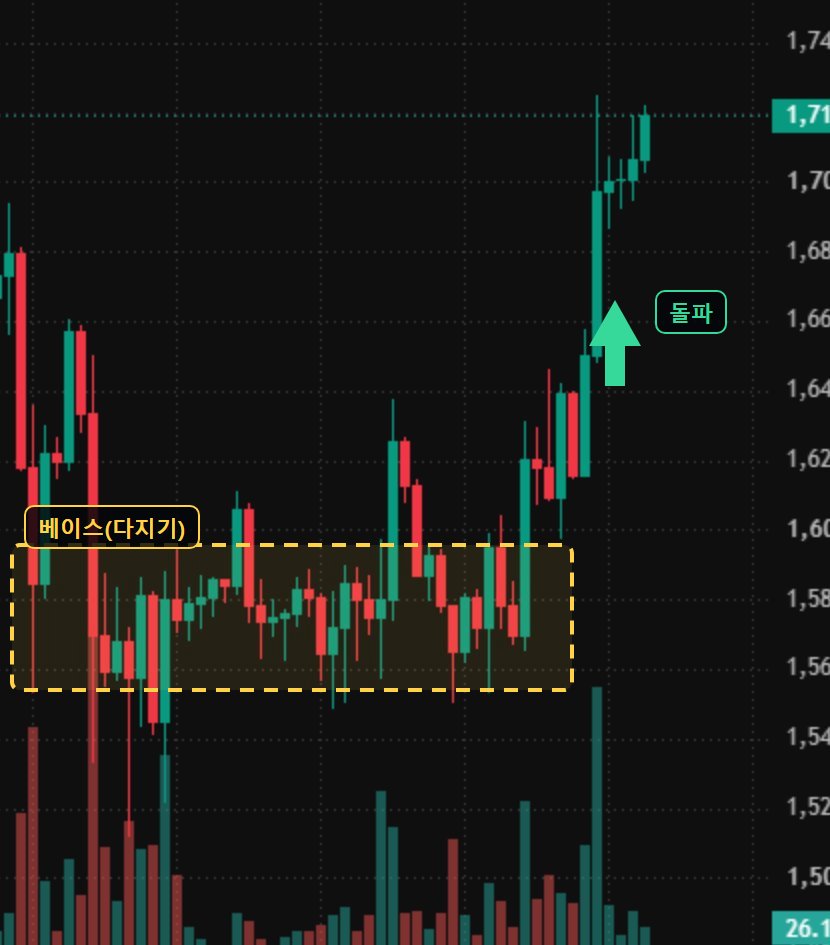
A VCP is identified by measurement, not impression. There are three rules. ① Contraction count — pullbacks (corrections) within the base typically repeat 2–4 times. ② Shrinking depth — each pullback's decline shrinks to roughly half of the prior one. For example, a first pullback of -24%, a second of -12%, a third of -6% — the waves tighten as you move to the right. ③ Volume drying up alongside — trading thins out as the contraction proceeds, and the stretch just before the pivot should be the quietest in the entire base. Minervini explains this as a supply-absorption process in which the sellers get exhausted.
Identification starts from the left side of the chart, not the right edge. First, check for a prior uptrend — VCP is not a bottom-fishing pattern but a continuation pattern within a trend. Next, actually measure the span between swing highs and lows inside the base and confirm the depth is shrinking. A 'loose' base whose swings don't tighten but keep sloshing widely up and down gets dropped from the candidate list — that's the principle in this school. When porting this to crypto, confirming the structure on higher timeframes like the 4-hour or daily reduces noise — the framework was originally built on weekly and daily charts.
2–4 contractions; each contraction's depth shrinking to about 50% or less of the prior one; a final contraction in the single digits (%) is ideal; volume running below its recent-period average and trending down. If even one of the four conditions breaks — especially if the final pullback deepens again or volume picks back up — the Minervini school does not trust that base. The verdict isn't 'it looks like the pattern' but 'it passed the conditions.'
Entry Design — Pivot, Volume, and the Pullback Retest
The pivot (buy pivot) is the high of the final contraction — the last line of resistance left in the base (it shares only a name with the indicator pivots P, R1, and S1 calculated from the prior day's high, low, and close; they are entirely different concepts). Entry methods split three ways. ① Entry on the break — entering the moment price crosses the pivot; you never miss the move, but you take false breakouts head-on. ② Entry on close confirmation — entering after the candle closes above the pivot; you filter out wick breakouts, but your entry price is higher. ③ Waiting for the retest — entering after the breakout pulls back to the pivot and it holds as support; the strongest filter, but you miss entirely any breakout that never pulls back. None of these is the 'right' one — it's a choice about what you filter out and what you give up.
- Judge the higher-timeframe trend — confirm the daily is above its long-term moving average with highs and lows rising together. If not, the very premise of this setup is absent.
- Measure the contraction — measure the depth of each pullback inside the base in %, and confirm the halving rule and declining volume. If it doesn't pass, drop it from the candidates and wait.
- Draw the pivot in advance — draw a line at the high of the final contraction. A line drawn after the breakout happens isn't design; it's hindsight.
- Define the volume condition as a number — e.g., breakout-candle volume at least 1.5x the 20-candle average. Only a criterion nailed down in numbers beforehand keeps the excitement of the breakout moment from substituting for judgment.
- Calculate the invalidation distance — e.g., with a pivot at $3,120 and the final contraction low at $3,020, the distance to invalidation is about 3.2%. If that distance exceeds what you can absorb, you discard the setup no matter how pretty the structure looks.
- Back-calculate size and set the target — if you allow $100 (1R) per failure, the notional position comes to about $3,120 ($100 ÷ 3.2%). Set the target at 2R (+6.4%) and the profit-and-loss structure is complete before entry.
The practical reason this technique waits for a contraction isn't predictive power — it's the tightly defined invalidation distance. The tighter the stop, the larger the notional you can carry for the same 1R, and the more structurally favorable the risk-reward becomes against the same target. The general framework of designing a setup around four elements — conditions, entry, invalidation, target — is covered in the four elements of a trading setup.
Telling False Breakouts Apart — Half of All Breakouts Come Back
A false breakout is a move that appears to clear the boundary, then gets pushed back inside the box. There's a structural reason it happens so often. The area just outside the boundary is dense with stop, pending, and liquidation orders — even a brief poke there triggers a chain of fills that manufactures a burst that looks like a breakout. Wyckoff called this move within a distribution zone an upthrust (Wyckoff theory), and modern traders call the same picture a stop hunt or liquidity sweep. Whatever the name, the very fact that orders pile up beyond the extremes is the soil that grows false breakouts.
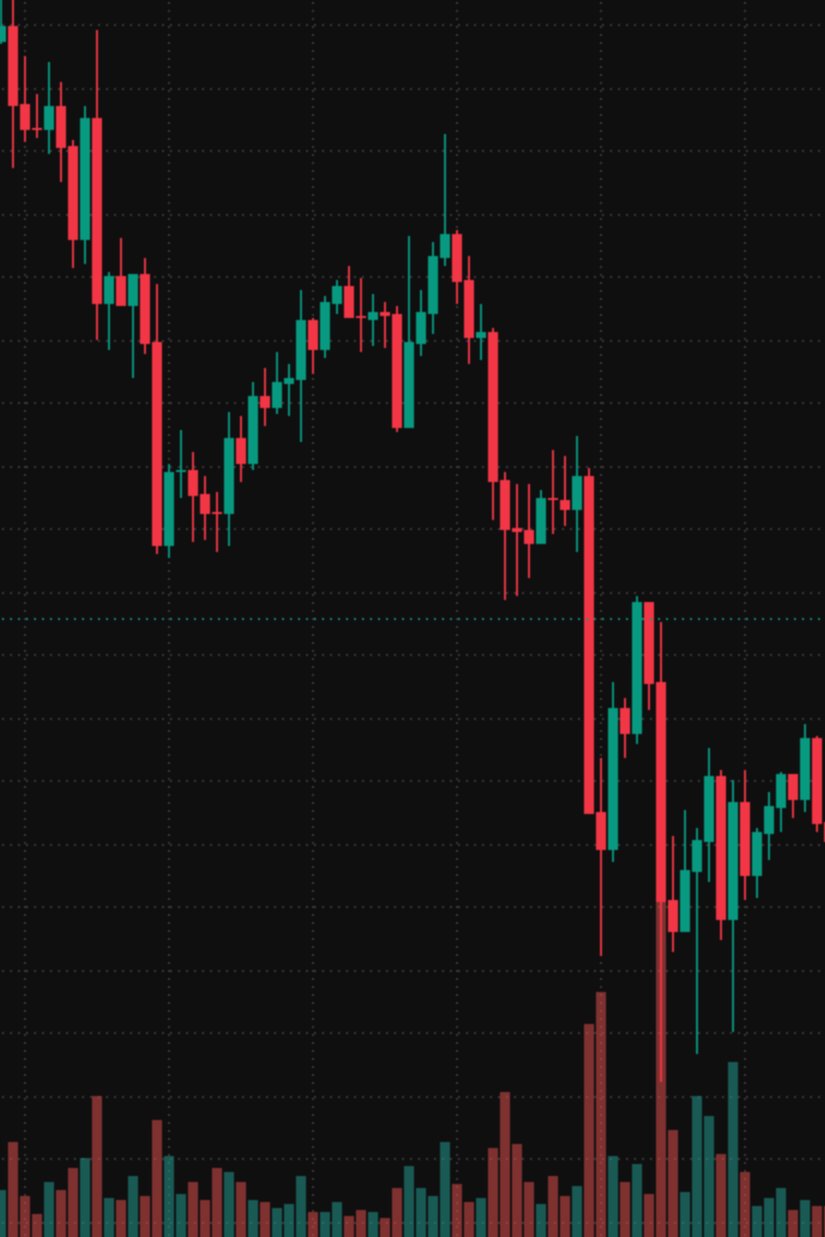
The filters breakout traders use cluster into five. ① Missing volume — if the boundary is crossed but trading doesn't build behind it, it's read as a sign that big money didn't join in. ② Close failing to hold — price pierced the level intraday, but the candle closed back inside the box, leaving only a wick. ③ Breakout without contraction — a breakout that jumps out of a wide, loose box with no tightening process beforehand is considered failure-prone. ④ Failed retest — on the pullback, the pivot fails to act as support and gives way. ⑤ Time filter — watch whether price holds above the pivot for the 2–3 candles after the break. No single one is the deciding blow; the more of them stack up, the higher you raise your guard.
If you chase a price already extended several % beyond the pivot, the invalidation point stays put while your entry price rises — the stop distance doubles. In the earlier example, an invalidation distance of 3.2% stretches past 6% if you chase at pivot +3% — the same failure becomes twice the loss, and with leverage on top it grows by that multiple again. A large share of breakout-trading losses are manufactured not by the breakout call, but by the entry location.
Invalidation and Stops — A Return Into the Box Is the Signal
Invalidation is defined in stages, not by feel. ① Warning — if price closes back below the pivot, half of the breakout thesis has collapsed. ② Scenario discarded — if price breaks down through the low of the final contraction, the 'contraction then release' structure itself has been negated; by this school's rules, that's the spot to close the position. ③ Structure broken — if price collapses to the base low, the read flips to the possibility that this was a topping pattern, not a continuation pattern. Where exactly you place the stop varies by style, but holding on past ② is outside the grammar of this technique.
The fact to accept is that breakout failure is not an exception — it's part of this technique. The Minervini school doesn't assume every breakout succeeds; it explains that you cut failures fast and small and build a structure where the successful few grow into trends and cover the losses. Failure is also information — an upward attempt getting turned back is evidence the opposing side is strong, and the saying 'a fast move in the opposite direction follows a false breakout' comes from exactly this reading. That said, in high-leverage futures the reversal itself can lead straight to liquidation, which makes breakout trading without an invalidation point especially dangerous in crypto.
① The chop of a sideways market — in directionless stretches, breakouts fail back to back and stops accumulate. Reports that simple breakout strategies' backtest results diverge sharply by market regime are consistent. ② Hindsight confirmation bias — on a chart that's already played out, every big rally looks like it was preceded by a VCP. Unless contraction depth and volume criteria are nailed down in numbers, the verdict drifts into discretion — and a technique judged by discretion is hard to verify. ③ The limits of the track record — a championship win is the performance of a specific person in a specific regime, not a guarantee of the technique itself, and the rule numbers (contraction count, depth, volume multiple) vary slightly across the literature, making independent replication difficult. ④ Crypto's particular costs — with a 24-hour market's frequent attempts multiplied by fees, funding, and leverage, each failure costs more than it does in stocks.
Whale Story's Measured Data — Whale Position Changes Around Breakouts
A chart's volume bars show 'how much' traded, but not 'who' bought. The final question that separates a breakout's quality — was big money behind this burst — is observed more directly in fills and position data. Whale Story's live tracker shows, in measured data, whether large fills are actually flowing in as the breakout candle forms, or whether it's a quiet breakout crowded with small fills only, and the per-coin whale position changes let you cross-check whether the breakout's direction lines up with the direction of big money.
① During the contraction, record which way whale positioning is skewed → ② At the moment of the breakout, confirm whether large fills print in a cluster near the pivot → ③ If the burst fired without a contraction after price had already run up a lot, cross-check against the suspected-top signals for the possibility that it's the final blow-off of an overheated move rather than a base breakout. This is not a tool that makes the breakout call for you — it's supplementary data for observing the real money flow behind the volume bars.
What Whale Story has observed — in the large-fill data on the live tracker, breakouts that later carried into a trend and breakouts that were reversed right away have repeatedly been observed to show different faces in the money inflow at the moment of the break. Breakouts that followed through tended to print clusters of large fills near the pivot, whereas reversed breakouts often slipped by quietly on mostly small fills. There have been cases where accumulation-style movement by smart-money wallets was observed first during the contraction and a breakout followed, and conversely, bursts that fired at the end of a run-up with no contraction have coincided with suspected-top signals lighting up — a measured clue separating a base breakout from the final blow-off of an overheated move. This is only an observation of tendencies in past data; it does not guarantee future breakout success and is not a recommendation to trade any specific instrument.
FAQ
Does the VCP pattern apply to crypto charts too?
The phenomenon of volatility contracting and then expanding shows up regardless of asset class, and the same structure is observed on crypto charts. That said, VCP is a framework built on the weekly and daily timeframes of stocks, so in crypto futures — running 24 hours with leverage on top — the same pattern can break down faster and more roughly. Confirm the structure on the 4-hour timeframe or higher, and factor in that the shorter the timeframe, the larger the share of noise.
Which is better — entering at the moment of the breakout, or waiting for the retest?
It's a trade-off. Entering on the break means you never miss a breakout that runs without pulling back, but you take false breakouts head-on; waiting for the retest filters false breakouts best, but you miss strong breakouts entirely. Either way, if you define the invalidation point and stop distance first, the loss is bounded — which is why this school's common explanation is that invalidation design matters more to the outcome than the choice of entry method.
Is every breakout without volume a false breakout?
No. Missing volume is only a warning sign that raises the probability of failure, not a verdict — and conversely, a breakout with heavy volume can still be reversed. Breakout traders layer volume, whether the close holds, whether a contraction preceded it, and the retest reaction, and even then they set an invalidation point in advance on the assumption they'll still be wrong sometimes. The moment this technique leans on a single filter, it gets close to a coin flip.
Can I turn a profit just by learning breakout trading and VCP?
No. Breakout trading is a technique designed around the premise of failure, stretches of consecutive stops are common in sideways markets, and the publicly verified results are one person's track record, not a guarantee of the technique. The ones who survived, it's said, were those who had invalidation criteria and position-sizing rules in place before the eye for the setup. This piece is educational material and recommends no specific trade, and leveraged trading can lead to a total loss of principal.