Trend Following — Trading Where the Rules Are Everything: Turtle Rules, Trend Identification, Pullback Entries, Invalidation
Published 2026.07.03 · Updated 2026.07.06
If you searched for a trend-following strategy, you were probably expecting a formula that tells you where to buy. This piece gives you the opposite answer — trend following isn't a technique for calling direction; it's a design that gives up on prediction and instead nails down entries, adds, stops, and exits as fully mechanical rules. What the 1983 Turtle experiment handed its beginners in just two weeks wasn't instinct either — it was that rule document. This piece dissects the actual numbers in the Turtle rules, the procedure for identifying a trend on a chart, how to pick entry points inside a trend, and where you admit you're wrong. It also hides nothing about the structural limitation — the way a ranging market grinds down an account.
- Trend following is not directional prediction but a system of mechanical rules — 'board a trend that's already confirmed, get off when it bends' — with no room for discretion anywhere in entry, sizing, adds, or exits.
- Under the Turtle rules, entries are 20-day and 55-day breakouts, the stop is 2N, and pyramiding adds at ½N intervals up to 4 units — the volatility unit N works backward to determine both stop distance and position size.
- The performance structure is frequent small losses covered by rare large gains. If you can't keep stops short and hold winning positions until the signal fires, this arithmetic collapses.
- Whipsaw losses in ranging markets and lag (giving back profit from the peak) are structural costs that cannot be removed — and failing to endure those costs and abandoning the rules is the most common path to failure.
Trading Without Prediction — Trend Following's Terms of Contract
Trend following is not a technique for guessing where the market will go. You confirm a move that has already started via a signal, climb aboard, and get off when a signal says it has bent. In exchange for giving up prediction, it leans on a recurring property of markets — that a big trend, once formed, tends to last longer than expected — and accepts the losses incurred during the stretches when that property fails to show up as a cost of doing business. The lineage traces back to Richard Donchian's four-week rule in the 1950s — 'buy a breakout to a four-week high, sell at a four-week low' — and even today a substantial portion of the CTA (managed-futures) industry is understood to run strategies of this family.
Before you can use this method, there are three terms of contract you have to sign. First, you will never buy the bottom or sell the top — signals arrive only after a trend is 'confirmed,' so they are structurally late, and all you can take is the middle chunk of the trend. Second, losses occur far more often than gains — most breakouts end in failure, and performance is made by a handful of big trend stretches. Third, there is no discretion — when the rules give a signal, you take it; when the rules say get out, you get out. If any one of the three is emotionally unacceptable to you, this method only works on paper.
Trend following is not an entry technique — it is a loss-management system with an entry signal bolted on.
Dissecting the Turtle Rules — Entry, Adds, and Exits, All Mechanical
In 1983, Chicago futures trader Richard Dennis staked a hypothesis — 'traders can be made' — recruited applicants with no experience through newspaper ads, taught them nothing but rules for about two weeks, and then handed them the firm's real money. These 'Turtles' are said to have gone on to earn more than $100 million as a group. The reason this anecdote matters is not the performance itself but the fact that what was transmitted was not instinct but documented rules. In the original rules published by ex-Turtle Curtis Faith, there is no room for judgment anywhere in entry, sizing, adds, or exits.
Entry — System 1 enters on a 20-day breakout to new highs or lows; System 2 on a 55-day breakout. Sizing — 1 unit is calculated from the instrument's volatility N (today's ATR concept), so that a single stop-out hits the account equally hard regardless of the instrument. Stop — if price moves 2N against the entry, you exit, no exceptions. Pyramiding — add 1 unit each time price moves ½N in your favor, up to a maximum of 4 units. Exit — System 1 exits on a 10-day breakout in the opposite direction, System 2 on a 20-day. Not a single item asks 'what do you think.'
Put into numbers, it looks like this. Say BTC is at $60,000 and recent volatility N is $1,200. Enter on a 55-day breakout to new highs, and the stop is automatically set 2N below at $57,600 (−4%). If the account is $10,000 and you cap a single stop-out at 1% of the account ($100), the size works out backward to $100 ÷ $2,400 = 0.042 BTC (roughly $2,500 notional). On an instrument twice as volatile, the same formula automatically halves the size. It's arithmetic, not prediction.
The price this mechanical rule set pays is a low hit rate. Consider some hypothetical arithmetic. Out of ten signals, lose seven at −1R and win three at +4R, and the total is −7R + 12R = +5R. Conversely, win nine times at +0.5R each but take a single −10R, and the total is negative. The Turtle rules are a device that forces the former structure — the 2N stop cuts losses short, while pyramiding and the trailing exit carry winning positions all the way through. Being wrong often is not a bug of this design; it's the spec.
The Trend Identification Procedure — High-Low Structure and Moving Averages
Before running the rules, you first have to determine whether a trend exists right now. The classic definition is highs and lows rising together (uptrend) or falling together (downtrend), and moving averages are the guide lines for reading that structure quickly. Identification works from higher time frames down — the daily gives you direction, the 4-hour and 1-hour give you the phase. The principle behind dividing roles across time frames is covered in the time frames piece.
- Mark swing highs and lows on the daily — if highs and lows are being renewed in the same direction, classify it as a trend; if they're tangled, classify it as a range. If it's ambiguous, it's a range.
- Check the moving-average alignment — see whether the short-term (e.g., EMA 20) and long-term (e.g., EMA 50, 200) averages are stacked in the same direction and price sits above them (below, in a downtrend). If the averages are knotted flat, treat it as 'cannot be determined.'
- Classify the phase — near new highs is the breakout phase; pulled back toward the moving averages is the pullback phase; threatening the prior swing low is the damage-watch phase. Which entry structures are available depends on the phase.
- Verify with volume — check that volume loads onto moves in the trend's direction and dries up on pullbacks. If it's the reverse, question the trend's quality.
- If even one check fails, stand aside — half of trend following is doing nothing when there is no trend. The moment you manufacture a signal, it's no longer this method.
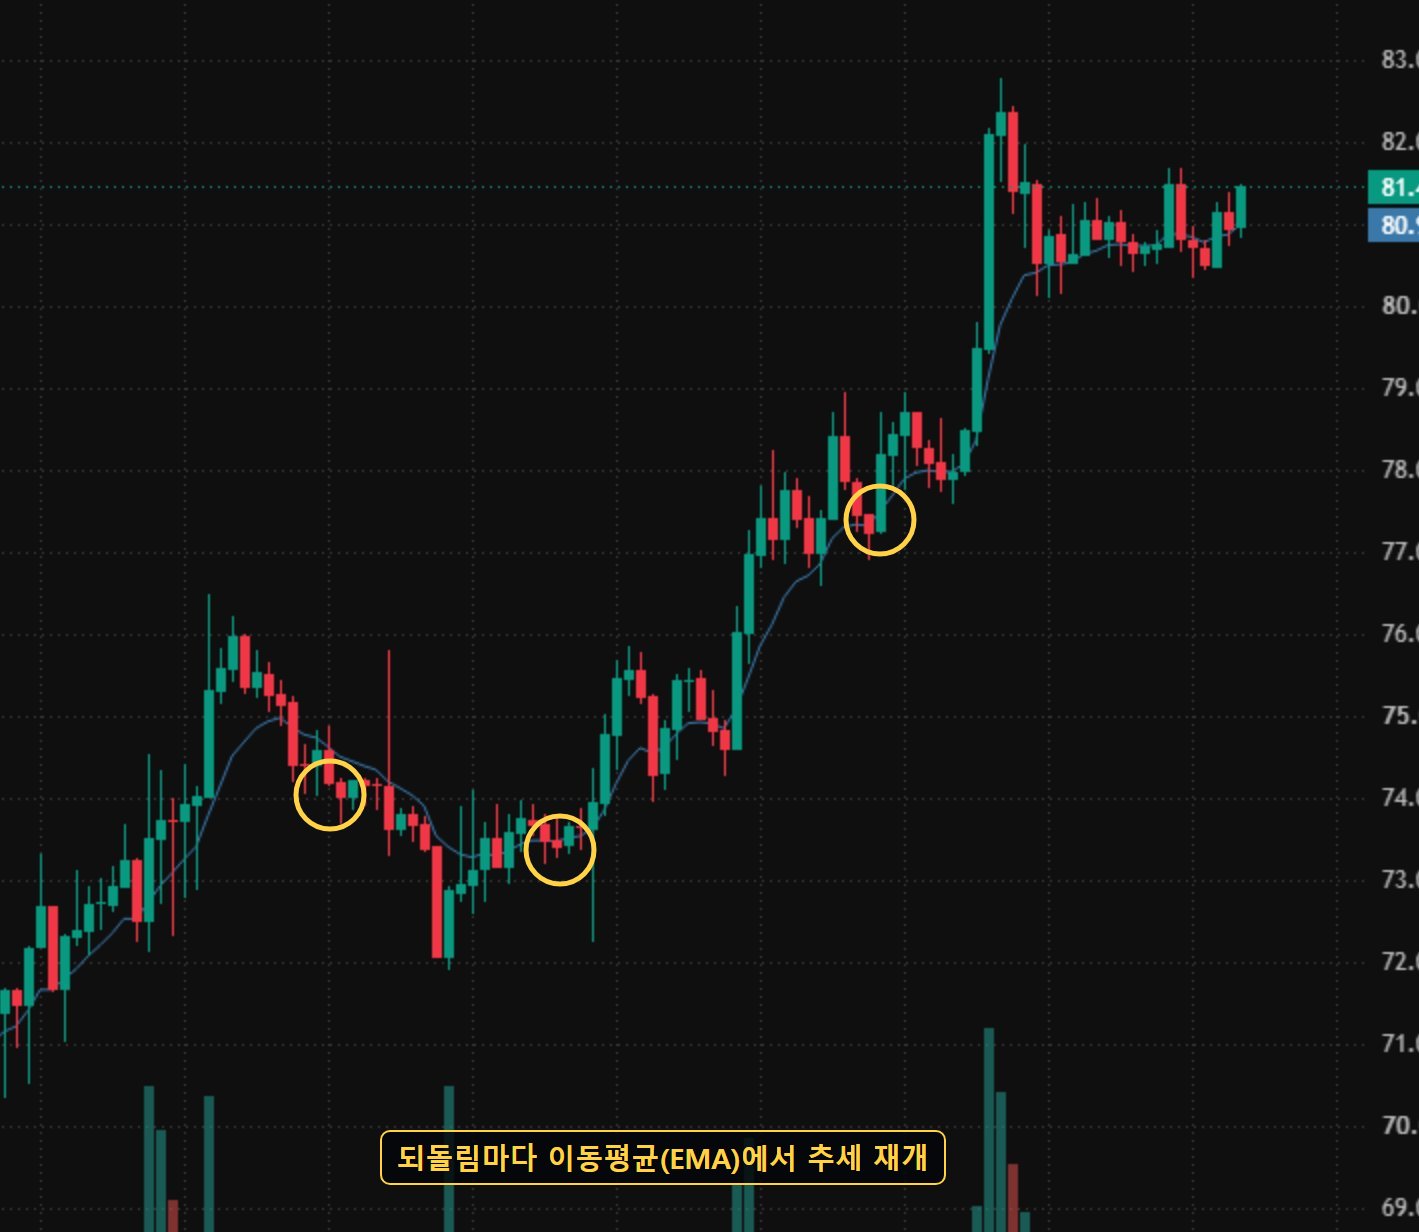
The chart above is the archetype that passes every identification test. Highs and lows rise together, price moves above the moving averages, and on every pullback a buying response appears near the average before the trend resumes. One caveat — identification is always a statement about 'so far.' At the right edge of the chart, this structure can break at any moment, which is why what matters more than identification is the invalidation criteria covered in the next section.
Pullback Following — Entry Points Inside a Trend
There are broadly two points at which to board a trend. Breakout following enters the moment a new high prints — the signal is clear, but the entry price is high and it's vulnerable to fakeouts. Pullback following enters where a correction within the trend ends and the direction resumes — the entry price is favorable and the invalidation point is close, so the stop distance is narrow, but you pay the cost that a strong trend may run off without giving a pullback. Either way, it has to be a setup written down in four parts — conditions, entry, invalidation, target — a framework covered in the trading setups piece.
The signature structure of pullback following is the EMA crossback. It's the scene where, during an uptrend, price briefly slips below the moving average and then reclaims it — the same structure that U.S. stock champion Oliver Kell adopted as the trend-resumption signal in his price action cycle. Let's put the structure into numbers. Say SOL prints a high at $150, pulls back to $144 near the EMA, and a reclaim candle appears at $146. Entry $146, invalidation below the pullback low at $143 (−2.1%), and the first reference point is the prior high at $150. A $3 stop against $4 to the prior high — stop there and the risk-reward is only about 1.3 — but trend following's target is not the prior high; it's the extension beyond it, so the design carries part of the position until a trend-termination signal.
Pullback following's invalidation is unambiguous. If the pullback low breaks, it wasn't a pullback — it's trend damage, and the scenario itself is void. Above that sit two more layers of invalidation — a break of the prior swing low on the daily, and the moving averages flipping into bearish alignment. Those aren't signals against a single entry; they retract the very determination that 'a trend exists.' The moment you hold on without invalidation, telling yourself 'it'll come back,' it's no longer trend following — it's hope holding.
The Limitation — How a Ranging Market Grinds Down an Account
This method's bill arrives in a ranging market. Inside a box, breakouts keep ending in failure and −1R stop-outs stack up like saw teeth — the so-called whipsaw. Eight straight −1R losses is −8R; even risking only 1% of the account each time, that's an 8% drawdown, and you have to pass through that stretch on nothing but trust in the rules. The literature on this family of strategies agrees on the same properties — performance varies widely year to year, most of the profit clusters in a handful of big trend stretches, and when those big trends will arrive is, by definition, unknowable.
① Range-market whipsaw — accumulated losses can be softened by parameter tuning but never removed; they are a structural cost. ② Lag — the exit signal fires 'after' the trend has bent, so giving back a good chunk of profit from the peak is part of the spec. ③ Overfitting — tune breakout lookbacks and moving-average lengths to past data and the backtest looks beautiful while live trading collapses. There is no guarantee that parameters that worked in the past will keep working. ④ Crypto-specific costs — gapless crashes in a 24-hour market, funding that accrues the longer you hold, and, with leverage, the added risk that a single ordinary pullback can liquidate you.
Most common mistakes come from trying to dodge this pain — cherry-picking signals because losses are scary, taking profit early on winning positions, changing parameters mid-drawdown, averaging down when it's not in the rules. Every one of them is an act of breaking, by your own hand, the axis of expectancy — 'paying back frequent small losses with rare big gains.' This problem, where emotion collapses before the rules do, is handled as a procedure in the trading psychology piece.
Whale Story Observations — Whale Behavior in Trend Stretches
Trend following leaves a fingerprint on an account curve. Open a whale's profile on Whale Story's live tracker and a 90-day cumulative P&L curve is displayed — a curve that runs flat or slowly erodes for long stretches and then stacks profit in a few steep steps — frequent shallow losses, rare deep gains — is the archetype of the trend type described in this piece. Conversely, the always-holding type, which keeps its position regardless of direction, draws a curve that swings along with the price itself.
There's more you can cross-check with observed data during trend stretches. In the late stages of a sharp uptrend, the suspected-top signals page shows exhaustion observations, and the smart-money tracker shows deposit and withdrawal changes in verified big-player wallets. Not resting the judgment of 'is the trend still alive' on chart shape alone, but layering it against observed data, is how this site is meant to be used. Still, however beautiful a wallet's curve may be, it is only a record of the past 90 days — it guarantees nothing about the next 90.
The traces trend following leaves on real accounts can be checked against observed data on Whale Story. Open a whale's profile on the live tracker and a 90-day cumulative P&L curve is displayed — and trend-type curves are actually observed: long flat stretches followed by profit stacking in a few steep steps, resembling the frequent-small-loss, rare-big-gain structure described in this piece. In the late stages of a sharp uptrend, the suspected-top signals page shows exhaustion observations and the smart-money tracker shows deposit and withdrawal changes in verified smart-money wallets, so the judgment of whether a trend is still alive can be cross-checked against observed data rather than chart shape alone. This is, however, only an observation of past data — not a recommendation to follow any particular wallet or to trade.
FAQ
Can I apply the Turtle rules to crypto futures as-is?
The Turtle rules were designed on the assumption of 1980s commodity futures markets. Crypto futures trade 24 hours, are far more volatile, and accrue a running cost — funding — the longer you hold a position; the assumptions differ. The right order is to borrow the structure (the breakout definition, N-based sizing, the pyramiding ceiling, mechanical exits) but re-verify the parameters against data from your own market and your own timeframe.
What timeframe is trend following done on?
The original form is daily-chart based. The lower you go in timeframe, the more frequent the signals — but false signals, fees, and slippage grow with them, and the structure of paying back frequent small losses with rare big gains gets eaten by costs. Whatever timeframe you use, the basic division of labor is to determine direction on the higher timeframe and time entries on the lower one.
If I win fewer than half my trades, how can the account grow?
It's not that losses don't happen — it's designed so they happen often but small. Cap the stop at 1R and carry winning trades to the exit signal for several R, and total expectancy can be positive even with a losing majority. The trade-off is that drawdowns, where losses stack up in a row, are an unavoidable structural cost — and the moment you can't endure them and abandon the rules, the arithmetic collapses.
So which coin is trending right now?
That question I won't answer. This piece is educational material dissecting the structure of a trading method; it does not solicit an entry into any particular instrument at any particular time. No rule guarantees a profit, and leveraged trading can lead to the total loss of your principal. Every investment decision and its outcome is your own responsibility.