Funding Rates and Open Interest (OI) — Reading the Derivatives Market's Two Thermometers
Published 2026.07.06
You've heard that positive funding means a drop is coming, and you're not sure whether rising OI is good or bad — people usually search these two numbers for one reason: they want to read the tilt of the table that the chart alone doesn't show. This guide walks through the methodology in order — who actually pays whom via funding, what OI precisely counts, the four-quadrant grid for price-times-OI combinations, and how extreme funding becomes squeeze fuel. Along the way it also dismantles simplistic formulas like 'positive funding = imminent drop' and shows why they so often fail. These two metrics are not signals that call direction — they are thermometers for reading who is driving the current move and how crowded it is.
- The funding rate is not a fee the exchange collects — it is money the crowded side pays directly to the other side to keep the perpetual futures price tethered to spot. The sign shows the direction of the skew; the magnitude shows its intensity.
- Unlike volume, open interest (OI) counts how many contracts remain open. Rising OI means new money is entering; falling OI means positions are being cleared out through liquidations or profit-taking.
- Combining price direction with OI change gives you four quadrants that tell you whether the current move is driven by new entries or by liquidations. Two rallies can look identical on the chart, yet one with rising OI and one with falling OI are entirely different in character.
- When extreme funding overlaps with a spike in OI, that crowding becomes fuel for a squeeze — a cascade of forced liquidations when price snaps the other way. But extreme conditions can persist far longer than expected, which makes them poor timing tools.
Funding Rate — The Rent Longs and Shorts Pay Each Other
Perpetual futures have no expiry. Without an expiry, there is no built-in mechanism forcing the futures price back toward spot when it drifts away — so exchanges created the funding rate. When futures trade above spot (long skew), longs pay shorts; when they trade below (short skew), shorts pay longs — at a fixed interval (usually every 8 hours; every hour on venues like Hyperliquid), proportional to notional size. The key point is that this is not a fee the exchange collects but money traders pay each other. The basics are covered in What Is the Funding Rate?.
That makes the funding rate a direct measurement of position skew. Sustained positive funding means there is enough demand to hold longs even at a premium; sustained negative funding means the opposite. For BTC, +0.01% per 8 hours is the commonly accepted neutral level (roughly 11% annualized), and the further and longer funding stays away from it, the stronger the crowding is read to be.
Funding is charged on notional, not margin. Holding a 10x long on $2,000 of margin ($20,000 notional) with funding at +0.05% per 8 hours costs $10 per payment, or $30 a day at three payments — 1.5% of margin per day, roughly 45% per month, draining away even if price goes nowhere. This is why holding high-leverage positions through an overheated market becomes a cost game in itself, and this math should be read alongside the effective-leverage concept in the Leverage guide.
Open Interest (OI) — The Total Money on the Table
Open interest (OI) is the total value of contracts still outstanding — not yet closed or liquidated. It is often confused with volume, but they measure different things. Volume counts how much changed hands over a period of time; OI measures how much is sitting on the table right now. When a new long meets a new short, OI rises. When an existing long and an existing short close out against each other, OI falls. When an existing position simply passes to a new counterparty, volume rises but OI stays flat.
So the change in OI tells you whether money is flowing onto the table or off of it. Rising OI means new capital is entering — conviction is building, but so is a stack of potential liquidation inventory that can be forcibly cleared later. Falling OI means positions are being closed — whether through profit-taking, stops, or forced liquidation — and the table is getting lighter. It carries no directional information: OI alone cannot tell you whether the growth came from longs or shorts.
The absolute level of OI varies by coin and by period, so it means little on its own. What traders actually watch is rate of change and anomaly — how fast has OI grown versus its recent multi-day average, has OI spiked without price moving (a sign of a directional standoff building), did OI collapse alongside a sharp drop (liquidations being burned off). An altcoin whose OI-to-market-cap ratio has become unusually high is structurally primed for liquidation cascades on even small price moves.
Price × OI Four Quadrants — Identifying Who Is Driving the Move
Funding and OI gain their power when combined with price. Crossing price direction (up/down) with OI change (rising/falling) yields four combinations, and each gives you a hypothesis about who is making the current move. This is the backbone of derivatives-data reading.
① Price↑ + OI↑ = a rally driven by new longs. New money is coming in as price rises — classified as trend-continuation, but potential liquidation inventory stacks up alongside it. ② Price↑ + OI↓ = a rally driven by short liquidations and covering. It's not fresh buying but forced buybacks from shorts pushing price up, and once the liquidations are exhausted, the fuel cuts out. ③ Price↓ + OI↑ = a decline driven by new shorts. ④ Price↓ + OI↓ = a decline driven by long liquidations — once the capitulation is exhausted, the table is left lighter. In numbers: if BTC rises +3% from $65,000 to $66,950 while total OI grows from $18.0B to $19.5B, that's ①; if OI shrinks to $16.8B over the same rally, that's ② — the chart shape is identical, but the character of the rally is entirely different.
Layering funding on top as a third axis raises the resolution. If ① comes with a funding spike, it suggests late high-leverage long chasing is mixed in; if ② comes with negative funding, the move has a strong squeeze character. To confirm who is actually hitting the tape with aggressive buys or sells inside the candle, the standard pairing is cross-checking with Order Flow & CVD.
Extreme Funding — Crowding Becomes Squeeze Fuel
When crowding reaches an extreme, the physics of the table change. With one side overcrowded, a move in the opposite direction forces liquidations of positions hitting their liquidation prices — and those forced closes hit the market as market orders in the same direction as the move, amplifying it. A sharp rally into an overcrowded short book is a short squeeze; a sharp drop into an overcrowded long book is a long squeeze. The mechanism behind this chain is the same machine described in Liquidation Cascades.
Distance math makes this structure concrete. A 20x short's liquidation price sits roughly +5% above entry. In a zone where shorts have piled in deep enough to push funding sharply negative, a 5% bounce itself summons forced buying from the 20x shorts — potentially pushing price up to the next liquidation rung (around +6.7% for 15x shorts, around +10% for 10x shorts) in a chain. This is why unusually steep counter-moves have been observed in extreme-funding zones.
The most dangerous misreading is the inversion 'funding is extreme, so reversal is imminent.' In strong trending markets, extreme funding has repeatedly been observed persisting for days to weeks — crowding tells you the fuel exists, but not when it ignites. Taking a counter-trend position on funding alone means absorbing a squeeze of unknown timing with your own account, and with leverage on top, the account can be finished before the reversal ever arrives.
Check Routine — Pre-Entry Derivatives Checks and the Limits of These Metrics
Funding and OI are not setup-generating indicators — they are indicators for validating the background conditions of a scenario you have already built. Reconstructed for learning purposes, the typical check sequence traders use looks like this.
- Check funding sign and magnitude — how far is current funding from neutral (around +0.01% per 8 hours for BTC), and how many days has the same sign persisted? If it differs across exchanges, note which market the crowding sits in.
- Check the OI trend — has OI spiked or collapsed versus its recent multi-day average? Classify an OI spike during flat price as a directional standoff building, and an OI collapse alongside a sharp drop as liquidations being burned off.
- Classify the quadrant — place the current price move into one of the four price-times-OI quadrants and form a hypothesis: is it driven by new entries or by liquidations?
- Compare against your own scenario — if your scenario points the same way as the crowding, ask 'am I the last chaser in?'; if it points the other way, ask 'does my stop structure survive the squeeze fuel?'
- Re-confirm invalidation — derivatives data does not set your invalidation point for you. Stops always live on price structure; funding and OI are only grounds for adjusting position size and holding time.
The limits are just as clear. First, lag and the snapshot problem — OI and funding are records of crowding that has already formed, not previews of the next move, and fitting extreme-value thresholds to past data slides easily into overfitting. Second, opaque aggregation — exchanges differ in aggregation methods and coverage, so OI figures differ across data providers, and single-exchange events (listings, one-off flows) can distort the aggregate. Third, interpreting who is behind an OI change is always an inference — the same OI decline could be profit-taking or forced liquidation, and the numbers alone cannot tell you whether the growth came from hedging flow or directional bets.
Structures that harvest funding — spot long plus futures short (cash-and-carry) — do exist, but they are a separate strategy whose returns vanish when funding compresses or flips, and which carries exchange risk; they are not risk-free interest. Narratives like 'a safe way to just collect funding' omit these costs and tail risks. No combination of derivatives metrics eliminates the possibility of loss.
Whale Story in Practice — Watching Whale Position Skew Directly
The weakness of funding and OI is that they are anonymous aggregates — you know crowding exists, but you can't see who is crowded, at what price, or by how much. On markets like Hyperliquid, where positions are public on-chain, that anonymity peels away. The whale rankings on Whale Story's live tracker aggregate top whales' actual long/short direction, entry prices, and liquidation prices — showing crowding as wallet-level measurement. For the market structure, see What Is Hyperliquid?.
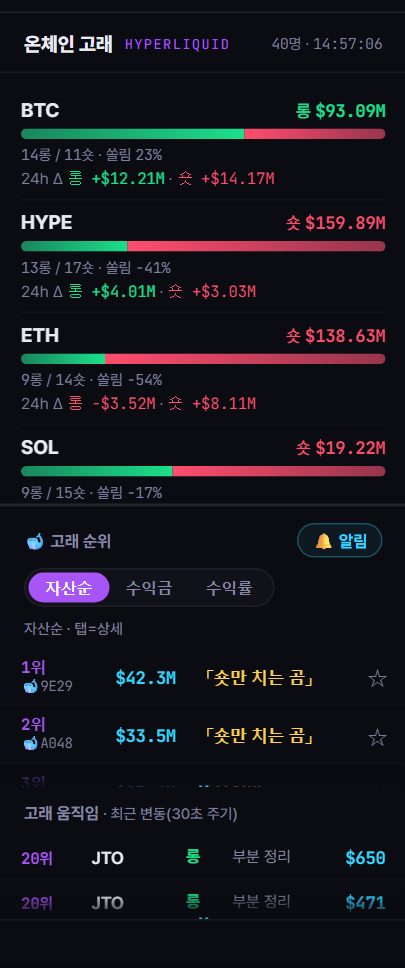
The way you read it changes too. If funding is extreme while most top whales sit on the opposite side, it suggests the crowding is likely small-account, high-leverage chasing. Conversely, if even the whales are piled into the same direction with liquidation prices clustered in a narrow band, that zone is where squeeze fuel is confirmed by direct measurement. Using whale data for this kind of structural reading — rather than copying direction — continues in The Whale Playbook. The same caveat holds: measured data is still an observation tool and guarantees nothing about the direction of the next move.
The crowding that funding and OI show only as aggregates can be checked at the wallet level on Whale Story. The whale rankings on the live tracker show top Hyperliquid whales' actual long/short direction, entry prices, and liquidation prices — so in extreme-funding zones you can distinguish whether the crowding comes from whales or from small-account, high-leverage chasing. In past observations, stretches late in a rally where OI and funding spiked together repeatedly overlapped with exhaustion readings from the suspected-top signals, and the smart-money tracker has recorded cases of smart-money wallets depositing to exchanges during those overheated stretches. These are tendencies in past data only, and guarantee no reversal or direction at any specific point in time.
FAQ
Does positive funding mean a drop is coming soon?
No. Positive funding is a record of a state — long crowding exists — not a preview of a decline. In bull markets, positive funding has repeatedly been observed persisting for weeks while price kept climbing. Funding is read most accurately not as a directional signal but as a thermometer measuring the intensity of the crowding and the cost of holding.
Is rising OI a good sign or a bad sign?
Neither. Rising OI is the neutral fact that new capital is entering and the table is getting bigger — it only takes on meaning when combined with price direction. Rising with price, it's classified as a new-buying-driven trend; rising during flat price, as a directional standoff building. At the same time, the larger the OI, the larger the potential liquidation inventory — both sides of that coin have to be watched together.
Where can I check funding rates and OI?
Each exchange shows the funding rate and OI for its own markets on the futures interface, and derivatives-data sites provide aggregates across multiple exchanges. Providers differ in coverage and aggregation methods, though, so the figures can disagree — it's safer to watch the rate of change within a single source than to compare absolute values.
What percentage counts as extreme funding?
There is no fixed threshold. Around +0.01% per 8 hours is commonly treated as neutral for BTC, and levels anywhere from a few times to tens of times that, if sustained, are often classified as overheated — but distributions differ by coin, period, and exchange, so mechanically applying a specific historical value slides easily into overfitting. The usual approach is to judge by anomaly relative to that coin's recent distribution.